Finance Market Stocks and Currency Visualization in React JS

Why take this course?
🚀 Master Finance Data Visualization with React JS & Redux!
📊 Course Title: Finance Market Stocks and Currency Visualization in React JS with Redux
🔥 Course Headline: Learn to visualize the live Stocks, Forex or your organization data using Highcharts library in React JS with Redux
👩💻 About This Course Are you looking to breathe life into financial data for stock market applications, currency analysis, or tracking your company's growth? Our comprehensive course, Finance Market Stocks and Currency Visualization in React JS with Redux, is the perfect guide for turning raw numbers into compelling visual stories.
Why Take This Course?
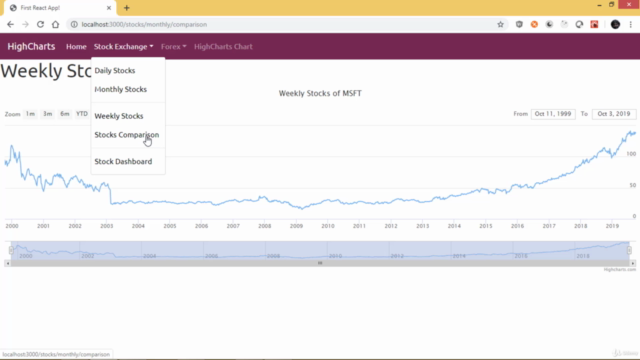
- Real-Time Data Handling: Learn to display live stocks and forex data using the powerful Highcharts library with HighStocks.
- Advanced Comparisons: Compare different company stocks and country currency trends, making complex data digestible at a glance.
- Custom API Integration: Utilize your own custom REST APIs developed with Express.js, Node.js, and MongoDB, then visualize the data with interactive charts.
- Dynamic Functionality: Implement drag-and-drop functionality and dynamically change chart types for a responsive user experience.
- In-Depth Charting: Explore various Highcharts visualizations, including OHLC (Open/High/Low/Close) and Candlestick charts for nuanced financial analysis.
- Personalization at Its Best: Customize your Highstocks charts to fit your brand or specific data needs.
Course Outline:
- Integrating Highcharts in React SPA (Single Page Application) 🌐
- Visualizing Live Stocks and Forex Data with HighStocks Charts 📈
- Comparing Different Company Stocks 💹
- Comparing Different Country Currency Trends 🌍
- Handling Custom REST APIs Data Visualization with Drag & Drop Functionality ➡️
- Utilizing Candlestick and OHLC Charts for Stocks and Currencies 📉📈
- Customizing Highstocks Charts 🎨
By the end of this course, you'll have a robust understanding of how to create captivating financial data visualizations that are both informative and engaging. You'll be equipped with the skills to translate complex financial datasets into compelling stories using React JS and Redux, all powered by the versatile Highcharts library.
📅 Enroll Now and take your first step towards becoming a pro in finance data visualization with React JS! 🎯
Don't miss out on this opportunity to elevate your finance applications with stunning, interactive charts. Sign up for Finance Market Stocks and Currency Visualization in React JS with Redux today and unlock the full potential of your financial data visualizations! 🚀
Course Gallery


Loading charts...