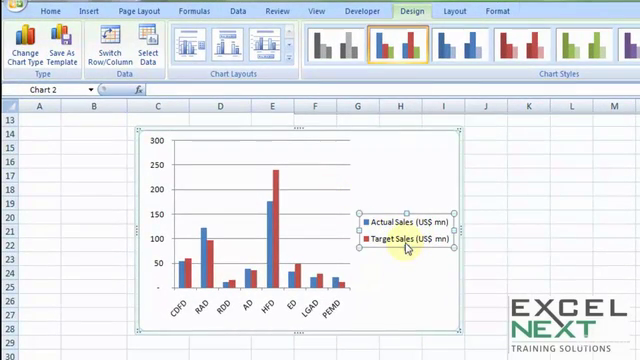
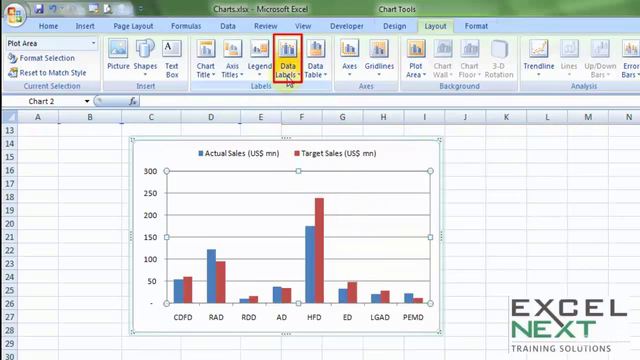
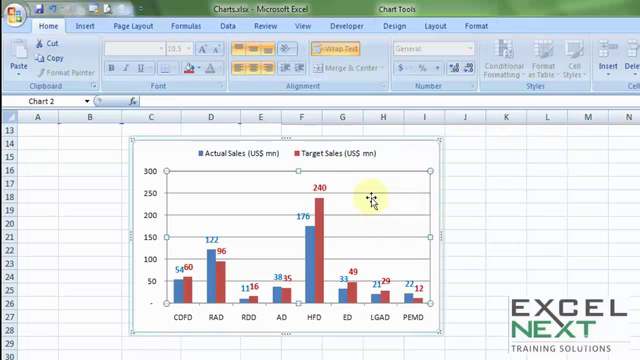
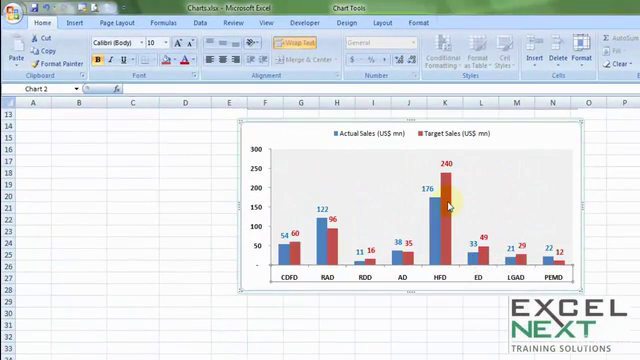
Excel Charts - Online Training

Why take this course?
📊 Unlock the Power of Data Visualization with Excel Charts!
👩💼 About the Instructor: CA. Rishabh Pugalia, the visionary founder of Excel Next, is your guide on this data-driven journey. With a passion for spreadsheet mastery and a knack for simplifying complexity, Rishabh is here to elevate your Excel skills to new heights.
Course Title: 🎓 Excel Charts - Online Training: Master the Art of Data Representation!
Headline: 🚀 "Charts - Thermometer Chart, 2-axis Chart, Exploded Pie Charts, Trendline, 80:20, Tips-n-tricks" - A Comprehensive Guide to Excel Charting!
Course Overview: Embark on a journey through the world of charts with our meticulously designed online course. Excel Next's Excel Charts Program is tailored to help you navigate and harness the full potential of Excel's charting capabilities. Whether you're a data analyst, a business professional, or someone who simply wants to present data more effectively, this course has something for everyone!
What You'll Learn:
- 🌡️ Thermometer Chart: Visualize growth and progress with the dynamic Thermometer chart.
- 🎉 Exploded Pie Charts: Break down complex data into manageable, visually appealing segments.
- 🛣️ 2-axis Chart: Analyze two different dimensions of your data side by side for deeper insights.
- 📊 80:20 Stacked Column Charts: Highlight the most significant segments of your data with a focus on key drivers.
- ➡️ Trendline: Predict and interpret trends using Excel's built-in forecasting tools.
- ✨ Intricate Settings and Shortcuts: Discover advanced features and time-saving tips to enhance your charting efficiency.
Why Choose This Course?
- 📚 eHandBook Included: A comprehensive guide that you can refer back to at any time.
- 🔍 Real-world Applications: Learn when and how to use each type of chart effectively.
- 🛠️ Practical Skills: Gain hands-on experience with exercises designed to reinforce learning.
- 👥 Interactive Learning: Engage with the content and become an expert in Excel Charting.
Your Instructor's Legacy: Rishabh Pugalia's work with Excel has been recognized globally. His innovative approach to teaching complex subjects makes even the most intricate concepts understandable and manageable.
Access the Course: Ready to transform your data into compelling visual stories? 🚀 Click Here to dive deep into Excel's charting capabilities with Excel Next's Online Training Program. Elevate your data presentation skills today and become the go-to expert in your organization!
Don't miss out on this opportunity to master Excel Charts! 📈 Enroll now and take your data visualization skills to the next level. Let's make complex data understandable, engaging, and insightful with the power of charts!
Course Gallery


Loading charts...