MS Excel 2019 - Data Analysis With Pivot Tables and Charts

Why take this course?
🚀 [MS Excel 2019 - Data Analysis With Pivot Tables and Charts] by Srinivas Reddy
🏆 Course Headline: Mastering Excel Pivot Tables & Data Analysis with Real time Scenarios by Microsoft Certified Trainer (Excel 2019) 🎓
🎉 Course Description:
In Udemy, this is the Best Excel Course for Pivot Tables & Pivot Charts! Unlock the Power of Data with Excel Pivot Tables 📊✨
Excel Pivot Tables are the essential tool for anyone delving into data analysis. They enable you to swiftly, accurately, and intuitively explore and analyze raw data, revealing insights and trends at the drop of a hat. 🧠💡
With this course, you'll gain a deep, 100% comprehensive understanding of Excel Pivot Tables and Pivot Charts. Srinivas Reddy, a Microsoft Certified Trainer, will guide you through interactive demos and hands-on exercises, ensuring you master every aspect of these powerful features.
Course Highlights:
-
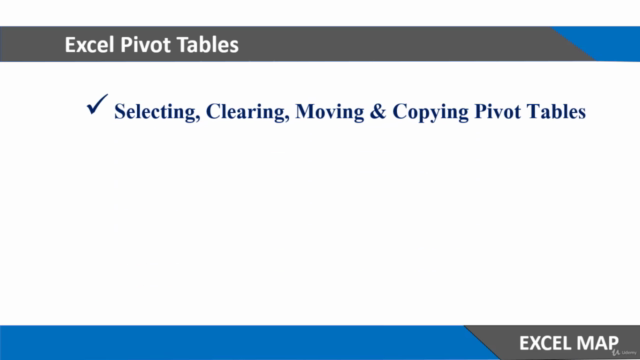
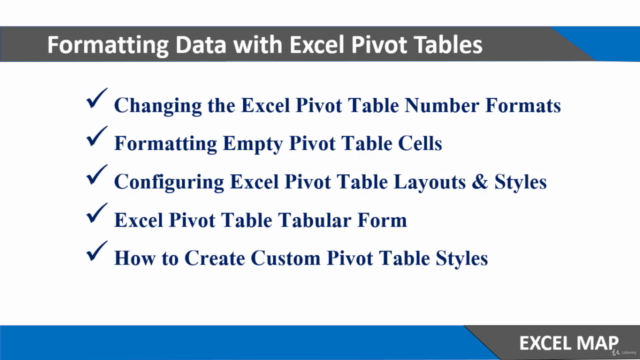
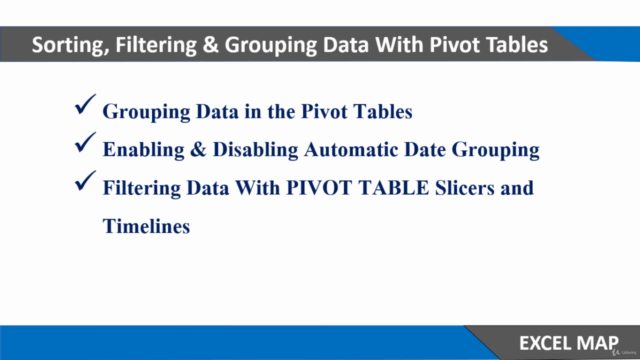
Understanding the Basics: Learn about the structure of raw data in Excel, Pivot Table layouts & styles, design & formatting options, sorting, filtering, grouping tools, calculated fields, and more. 📈
-
Advanced Techniques: Dive into Pivot Charts, slicers, timelines, interactive Excel dashboards, and writing formulas in Excel with ease. 🎨🔧
-
Comprehensive Resources: Benefit from downloadable resources, project files, homework exercises, quizzes, and enjoy lifetime access to the course with a 30-day money-back guarantee. ✅💰
-
Learn at Your Own Pace: Most lectures are compatible with Excel 2007, Excel 2010, Excel 2013, Excel 2016, Excel 2019, or Office 365. 🖥️
What You’ll Learn:
-
Elevate your data analysis skills from beginner to advanced with Excel Pivot Tables. 🚀
-
Utilize Pivot Tables and Pivot Charts to optimize your workflow in Excel. 🌐
-
Discover unique tips, tools, and real-world case studies that set this course apart from the rest. 🔍
-
Gain access to multiple examples to test your skills. 🎥
Course Requirements:
-
Microsoft Excel 2010, Excel 2013, Excel 2016, Excel 2019, or Office 365. 💻
-
Basic experience with Excel functionality like charts and formulas. (A big plus!) 📊🧪
Who is this course for?
-
ANYONE who uses Excel on a regular basis, from beginners to advanced users! 👩💻👨💼
-
Excel users looking to enhance their proficiency in data exploration and analysis. 📊
-
Students seeking an engaging and interactive approach to learning Excel. 🎓
-
Individuals aspiring to pursue a career in data analysis or business intelligence. 🤝
Join Srinivas Reddy and transform the way you handle data with Excel Pivot Tables & Data Analysis! 🌟💪
Ready to master Excel and become a data wizard? Enroll now and take the first step towards becoming an Excel expert! 🛠️💻🚀
Course Gallery


Loading charts...