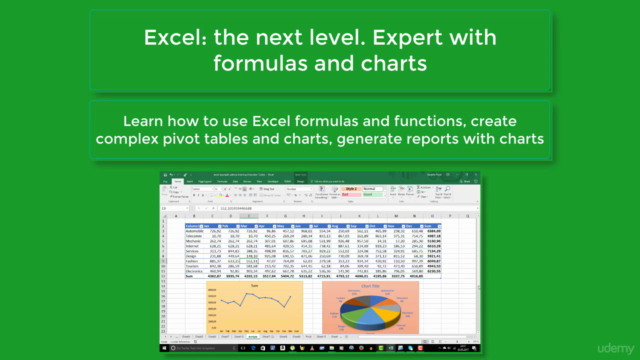
Excel: the next level. Expert with formulas and charts

Why take this course?
🌟 Course Title: Excel: The Next Level – Master Formulas & Charts 🚀
Headline: Unlock the Full Potential of Excel with Advanced Formulas, Pivot Tables, and Charting Techniques! 📊✨
Course Description: Are you comfortable with Excel basics but ready to take your skills to the next level? This course is designed for intermediate users who are looking to elevate their expertise in Microsoft Excel. Dive deep into the powerful features of Excel, learn to create professional reports with complex calculations, and master the art of data visualization through charts and pivot tables.
Overview:
- Getting Started: We'll begin by exploring the "Info" and "Options" areas in Excel, which are crucial for setting up your files and reports correctly. 🛠️
Core Modules:
-
Ribbon Exploration: A comprehensive overview of the functionalities and options available across all the ribbons in Excel to enhance your workflow.
-
Conditional Formatting: Learn to visually communicate patterns, trends, and exceptions within your data through advanced formatting techniques.
-
Data Validation: Define validation rules for cells and ranges to ensure data integrity and consistency.
-
Formula & Function Mastery: Dive deep into Excel's formulas and functions:
- Text functions for manipulating text strings.
- Lookup & Reference functions like VLOOKUP, INDEX/MATCH, and more.
- Information functions to extract specific data elements.
- Logical functions for decision-making in Excel (IF, AND, OR, etc.).
-
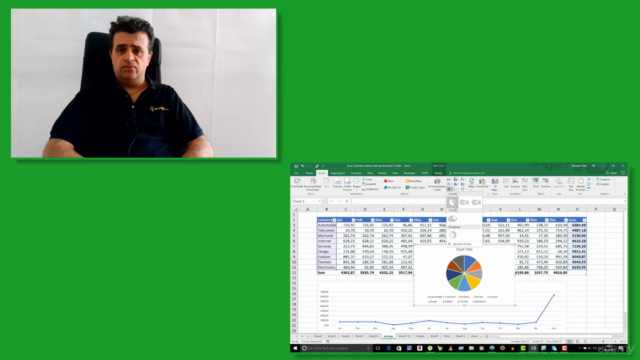
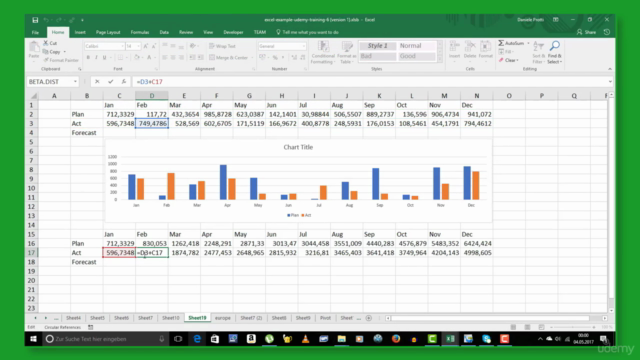
Charts & Graphs: Create impactful charts and graphs that represent different sets of data effectively.
-
Pivot Tables & Pivot Charts: Learn to create and manage dynamic pivot tables and pivot charts to summarize, explore, and present your data in a user-friendly manner.
-
Protection Mechanisms: Understand how to protect your worksheet or entire workbook to prevent unauthorized changes and enhance security.
Final Skills Outcome: Upon completion of this course, you will be able to generate complex reports that separate data from formulas, format tables professionally, and create charts and modify them with just a few clicks. You'll have the skills to handle large datasets with ease and present your findings in a compelling way. 📈
Why Take This Course?
- Industry Relevance: Excel is an indispensable tool across various industries, including finance, marketing, data analysis, and more.
- Career Advancement: Mastering advanced Excel skills can set you apart in the job market and open up new career opportunities.
- Practical Application: Learn through real-world scenarios that will help you apply your knowledge directly to your work.
- Peer Learning: Engage with fellow learners, share insights, and grow your professional network.
Enroll now and take the leap from an Excel user to a true data master! 💡🚀
Course Gallery


Loading charts...