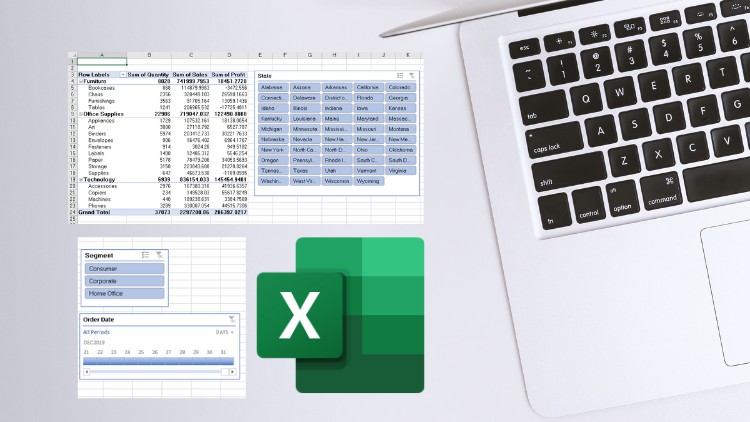
Excel Pivot Tables - Crash Course

Why take this course?
🚀 Course Title: Excel Pivot Tables - Crash Course
🎓 Headline: 📊 Learn Data Analytics with Helpful Pivot Tables in MS Excel. Use Pivot Tables to Get Answers to Business Problems.
Course Description:
In the fast-paced world of today, Data Analytics is not just a skill—it's a necessity for any business looking to thrive in an increasingly data-driven economy. With mountains of data at our fingertips, the ability to extract meaningful insights can be the key to unlocking success and informing strategic decisions. This is where mastery of Microsoft Excel's Pivot Tables comes into play!
Why Pivot Tables? 🤔
Pivot Tables are a powerful feature within Excel that allows you to summarize, analyze, explore, and present your data with just a few clicks. They are indispensable tools for anyone who works with large datasets and wants to find patterns, trends, or outliers that can inform business decisions.
What You'll Learn:
-
🌱 Understanding the Basics: Develop a solid foundation in Pivot Tables through our step-by-step guidance.
-
Creating Your First Pivot Table: Dive into creating a dynamic Pivot Table from scratch and see your data come to life.
-
Preparing CrossTabs: Learn how to organize data into tables of rows, columns, and headers that can be used for complex analysis.
-
Applying Filters: Discover the power of filters to easily manage which data is displayed in your Pivot Table.
-
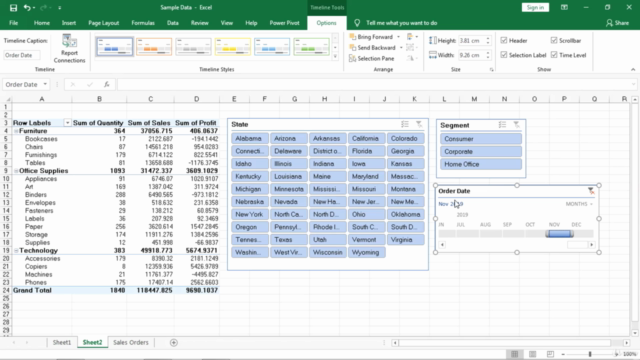
Using Slicers: Interact with your Pivot Tables like never before with visual slicers that make selection and comparison intuitive.
-
Working with Date Timelines: Manipulate date and time data effortlessly to track trends over periods of time.
-
Value Calculations: Perform various calculations, including totals, averages, and percentages, directly within your Pivot Table.
Why Enroll in This Course? 🎯
-
Real-World Applications: Learn by doing with real-world scenarios that mirror actual business challenges.
-
Flexible Learning: Study at your own pace, on your own schedule—whether you're a busy professional or a student.
-
Expert Instructor: Gain insights from an experienced educator who brings real-world expertise in data analytics and Excel.
-
Interactive Content: Engage with content that includes exercises, quizzes, and interactive elements to reinforce your learning.
-
Community of Learners: Connect with peers in a supportive community where you can share insights and learn from one another.
Don't let data overwhelm you. Harness its power with Pivot Tables and become the Data Analyst you were meant to be. Enroll in "Excel Pivot Tables - Crash Course" today and unlock the potential of your data! 💻✨
Course Gallery


Loading charts...