Excel Pivot Tables and Dashboard. Simple & Quick tutorial!

Why take this course?
🌟 Course Title: Excel Pivot Tables and Dashboards - Simple & Quick Tutorial!
Course Headline: Welcome to this easy 1-hour course on Excel Pivot Charts and Dashboards! 🚀
📈 Course Description:
Are you feeling overwhelmed by the vastness of Excel, or perhaps you've been postponing mastering it due to its complexity? Let me introduce you to a world where data analysis becomes a breeze with Excel Pivot Tables and Dashboards. This isn't just another Excel course; it's a 1-hour guide designed to simplify the process, making it accessible for everyone from beginners to those looking to sharpen their skills.
What You Will Learn:
- Data Entry and Basic Math: The foundational skills for any data analysis beginner.
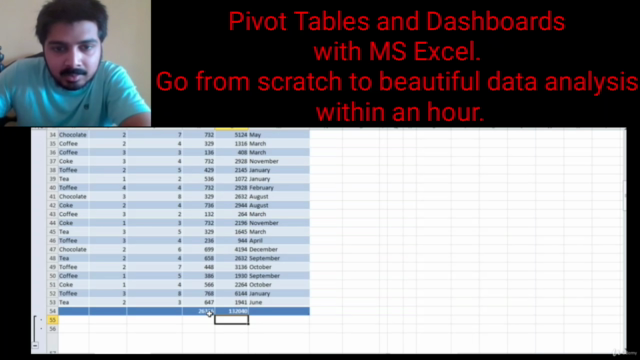
- Making and Using Data Tables: Tools that will organize your data efficiently, preparing it for deeper analysis.
- Basic Conditional Formatting: A visual way to highlight key information within your datasets.
- Checkboxes and Conditional Formatting Interaction: Combining formatting with user interaction for dynamic results.
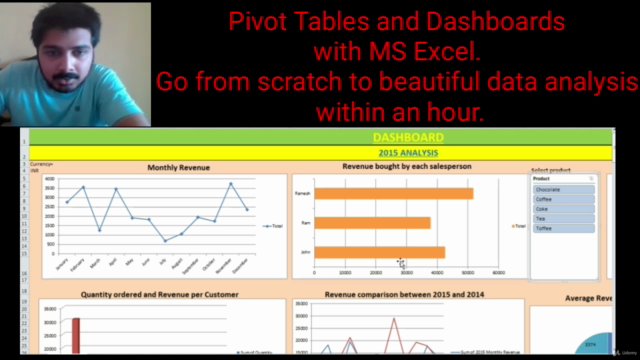
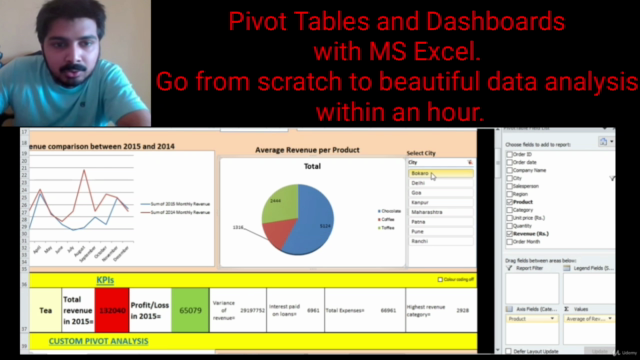
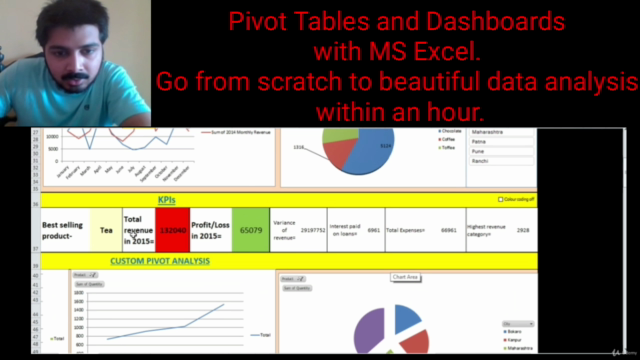
- Dashboards: The culmination of your data analysis journey, where you'll turn numbers into narratives.
Why This Course?
- Practice Along: Use the data table provided in the first lecture and follow along in real-time.
- Any Version of Excel Since 2010: Compatible with recent versions of Excel, ensuring you can apply what you learn regardless of your software version.
- Quick and Impressive Results: Learn how to perform data analysis quickly without sacrificing the depth or accuracy of your results.
- In-Demand Skills: Pivot Charts and Dashboards are essential tools in data analysis, and this course will equip you with the skills that are highly sought after.
Who Is This Course For?
Whether you're a complete beginner or an intermediate user aiming to refine your data visualization skills, this course is designed to cater to your needs. It's a stepping stone to advanced features in Excel, which I will cover in subsequent courses. But for now, let's focus on getting the basics right and mastering the art of quick and effective data analysis.
🔍 What's Inside:
- Interactive Lectures: Each concept is broken down into clear, concise lessons that you can follow and apply immediately.
- Practical Exercises: Real-world examples and exercises to solidify your understanding of Pivot Tables and Dashboards.
- Expert Guidance: I'm here to guide you through every step, ensuring you grasp the concepts without getting bogged down by complexities.
🚀 Join Now and Transform Your Data Analysis Skills!
Don't let data intimidate you anymore. Enroll in this course today and take your first step towards becoming an Excel pro. Remember, the skills you acquire here are just the beginning of a journey that could significantly impact your career. 💼✨
Your Instructor: Praharsh Chaubey - An experienced professional passionate about teaching and making data analysis accessible to all. I'm committed to providing you with the tools and knowledge necessary to excel in the world of Excel.
Enroll Now and Let's Turn Data into Dynamism! 🎉
📫 Feedback & Questions:
Your feedback is invaluable! If you enjoy this course or have suggestions, please let me know. I'm here to help and improve your learning experience. Got questions? Ask away, and I'll get back to you as soon as possible.
Ratings Matter:
If this course helps you, I'd truly appreciate a good rating. It not only motivates me but also helps others find the quality guidance they need.
Let's embark on this journey together and make data analysis a piece of cake with Excel Pivot Tables and Dashboards! 📊👍
Course Gallery


Loading charts...