Complete Introduction to Excel Pivot Tables

Why take this course?
🌟 Introduction to Analyzing Data with Excel Pivot Tables 🌟
Course Headline:
🚀 Learn to ANALYZE and SUMMARIZE data in seconds using Excel's most powerful data feature - Pivot Tables and Pivot Charts! 🚀
Course Description:
Are you ready to dive deep into the world of data analysis without falling into the time-wasting trap that so many other courses can lead you into? If you're looking for a course that not only covers the basics but also builds your knowledge in a logical, step-by-step manner, then look no further! 🧐
This course has been meticulously updated for 2024, ensuring that you learn on the latest Excel interface in full HD video quality. Whether you're a complete beginner or looking to sharpen your skills, this course will provide you with the crucial foundation you need to become a Pivot Table pro.
What Students Are Saying:
- "Excellent course! It goes over all the options available for working with big sets of data. Being familiar with pivot tables is a must in order to really grasp the formulas required to make this powerful feature a tool in your arsenal." 🚀
- "Great course, great teacher! I really appreciate those little notes explaining different ways to achieve the same results. Definitely recommend it strongly." 🌟
- "I just passed my Excel 70-779 test to complete my BI Solutions MCSA! Watched all your videos on here for both tests, and Ian, you're a legend. Thank you!" 🎉
- "Super great course! Gave me all the basics to get started using Power Pivot right away!" 📚
About the Trainer:
Ian Littlejohn is not just any ordinary trainer. With over 5 years as a top-rated instructor on Udemy and more than 10 years of experience in training & management consulting, Ian has mastered Data Analysis across platforms like Excel, Power BI, Google Data Studio, and Amazon Quicksight.
With an average course rating of over 4.5 and having helped over 250,000 students, Ian's reputation for delivering excellent, concise, and logically structured courses is well-established. His teaching method ensures that learners get the point across without unnecessary filler, making his courses a favorite among professionals looking to upskill.
About the Course:
In today's fast-paced business environment, skills in data analysis, reporting, and dashboard creation are crucial. Excel stands out as the most commonly used data analysis tool globally for developing reports, performing data analysis, and creating dashboards.
This course will introduce you to the incredible power of Pivot Tables to analyze and summarize data in mere seconds. Pivot Tables are truly Excel's most powerful feature, and mastering them can be a game-changer for your career.
Course Curriculum:
- Introduction and Course Content - We kick off the course by giving you an overview of what to expect and how the content will flow logically to build up your skills.
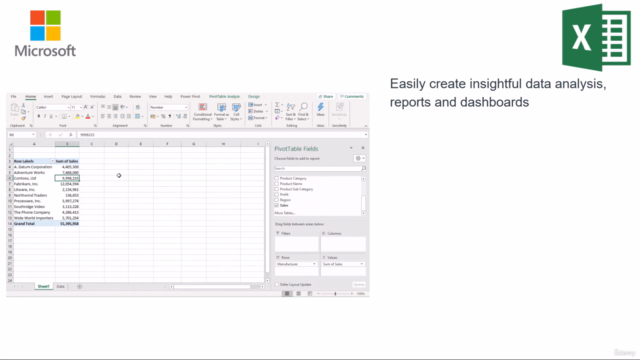
- Creating Pivot Tables - Learn the fundamentals of creating Pivot Tables, including setting them up and understanding the underlying structure.
- Methods of Aggregation and Grouping - Discover various ways to aggregate data and group your results for meaningful insights.
- Trend Analysis - Identify trends in your data to forecast future performance or behavior patterns.
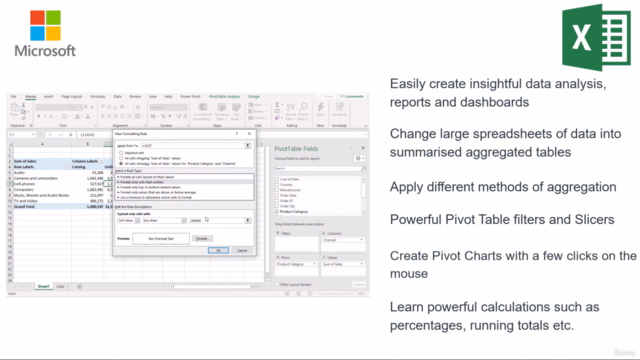
- Filtering and Slicing Pivot Tables - Learn how to filter and slice your Pivot Tables to drill down into the specific data you need.
- Show Value As Calculations - Explore advanced functions that allow you to show your data values as calculations, adding a layer of complexity and insight.
- Frequency Analysis - Analyze how often data points occur within a dataset, providing valuable insights into the frequency of events or patterns.
- Interactive Dashboards and Data Analysis - Create interactive dashboards that can transform raw data into actionable business intelligence.
- Course 1 - Complete Introduction to Excel Power Query - Learn how to streamline your data preparation process with Power Query (previous course).
- Course 2 - Complete Introduction to Excel Power Pivot - Understand how to manage large datasets and perform complex analytics using Power Pivot (previous course).
- Course 3 - Excel Interactive Dashboards and Data Analysis - This is the capstone course where you'll bring together all the skills learned in the previous courses to create interactive dashboards and conduct advanced data analysis.
Don't miss this opportunity to elevate your data analysis skills with Excel Pivot Tables and become a key player in your organization's data-driven decision-making process. Enroll now and take the first step towards mastering data analysis! 📈💻
Course Gallery


Loading charts...
Comidoc Review
Our Verdict
This popular Udemy course offers a deep dive into Excel PivotTables and Pivot Charts. While expecting some patience from beginners due to the fast pace of instruction, this comprehensive program provides solid explanations and hands-on exercises that will benefit anyone wanting to analyze and summarize data efficiently. With constant improvements over time, it remains an up-to-date resource for Excel users as they work towards mastering PivotTables features and functionality.
What We Liked
- Comprehensive coverage of Excel PivotTables, from basics to advanced features like filters and slicers
- Real-world examples and practical activities solidify understanding of key concepts
- Instructor's expertise in Excel and Power BI results in a well-designed course structure with logical steps and helpful repetition
- Valuable tips and tricks for those already familiar with PivotTables
Potential Drawbacks
- Pace of instruction can be too quick, especially for non-native English speakers or beginners in Excel
- Interactive dashboard section may seem elementary to some learners despite raising high expectations
- Lack of specific guidance for Excel 2010 users regarding the Slicer tab not being displayed on the ribbon
- Text-based lessons could be improved, feeling more like an afterthought compared to video content