Excel Interactive Dashboard

Why take this course?
🎉 Master Excel Dashboards with Mohammad Barghouthi (ProXperties) - "Excel Interactive Dashboard" 🚀
Course Headline: Unlock the full potential of your data with our comprehensive course on creating Dynamic Excel Dashboards! Discover the power of Standard and Uncommon Charts, along with mastering the art of Pivot Tables. Learn what truly matters and elevate your data presentation skills to new heights.
Course Overview:
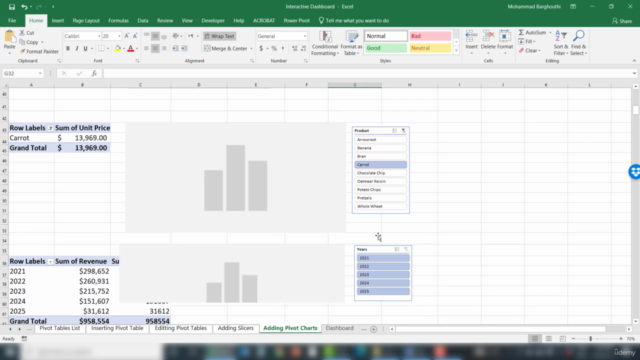
📈 Learn Excel Basics: Begin by grasping the essentials of Excel, including how to insert and edit pivot tables, slicers, and pivot charts. This foundational knowledge is crucial for creating dynamic dashboards.
Key Learning Areas Include:
-
Standard Charts: Understanding the common charts that form the backbone of any dashboard.
-
Pivot Tables Mastery: Learn to manipulate and summarize large amounts of data quickly and easily with pivot tables.
-
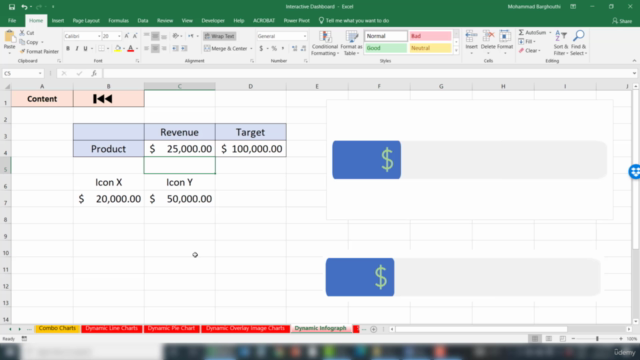
Advanced Charting Techniques: Go beyond the basics and explore advanced chart types like dynamic doughnut charts, rounded edges progress donut charts, dynamic line charts, overlay image charts, and more. These uncommon charts will set your dashboards apart!
-
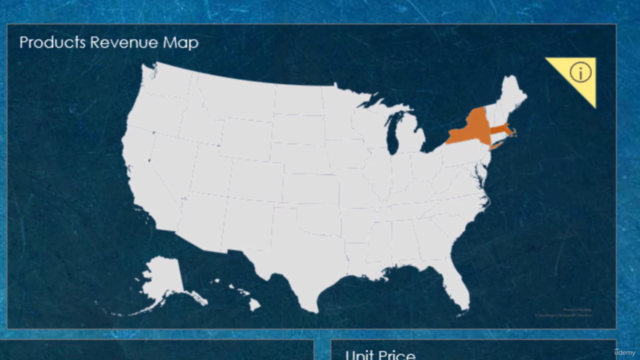
Dynamic Dashboards from Scratch: Learn to build interactive dashboards that tell a story with data.
Why Join This Course?
-
For All Levels: Whether you're a beginner, intermediate, or advanced Excel user, this course is designed to cater to your needs and elevate your skills.
-
Real-World Application: Not just theory, but practical application that will enhance the way you handle data in real-world scenarios.
-
Version Compatibility: The course is tailored for Excel 2019, yet the features discussed are largely available in previous versions, ensuring relevance no matter your Excel version.
Course Benefits:
-
Enhanced Sheets: Bid farewell to static spreadsheets and embrace dynamic dashboards that engage and inform.
-
Dynamic Charts: Learn to create charts that can adapt and change with your data, providing a more meaningful representation of the information you're working with.
-
Out of the Box Thinking: Challenge yourself with uncommon chart types that will make your dashboards stand out.
Join the Community:
🌐 This course isn't just about learning—it's about joining a community of thousands of students from around the globe who are all on a mission to transform their data into compelling narratives.
📅 Take Action Now: Don't wait to take your Excel skills to the next level. Download the accompanying course resources and start applying what you learn while you learn it.
Final Note:
Remember, whether you're a business analyst, a financial controller, a marketer, or simply someone who deals with data regularly, this course will equip you with the skills to present your findings in a way that is both visually appealing and analytically insightful.
💡 Stay productive, stay happy, and embrace the world of dynamic Excel dashboards! Sign up today and embark on a journey to become an Excel maestro! 🚀
Course Gallery


Loading charts...