Excel for Data Science and Machine Learning

Why take this course?
🚀 Excel for Data Science and Machine Learning - Perform Machine Learning and Advanced Statistical Analysis On Your Own - Even If You Don't Code! 📊
Course Headline: 🎓 Break Into Data Science Without Writing a Single Line of Code!
Why Use Excel for Machine Learning and Data Science? Excel might seem like the go-to tool for finance and business analytics, but it's also a powerful platform for machine learning and advanced statistical analysis. 💫
Do Data Scientists and Data Analysts Use Excel? Absolutely! While programming languages are essential for complex tasks, Excel serves as the gateway to data analysis for many professionals due to its widespread accessibility and user-friendly interface. It's the common ground where even non-techies can perform sophisticated ML techniques! 💡
Course Description:
Unlock the Power of Machine Learning with Excel:
- No Coding Skills Required: Dive into machine learning with just your curiosity and a spreadsheet.
- Easy-to-Understand Logic: Grasp the principles behind ML algorithms in a manner that's easy to comprehend.
- Immediate Application: Start applying what you learn right away, without waiting to become a coder.
Who Should Take This Course? If you're aspiring to become a data analyst or data scientist and you're not into programming, this course is your launchpad! 🌟
Key Machine Learning Methods You Will Master:
- Linear Regression: Understand the basics of predicting numerical target variable.
- Multiple Linear Regression: Learn how to predict outcomes using multiple independent variables.
- Logistic Regression: Explore the application of logistic regression for binary classification problems.
- Cluster Analysis: Discover methods to group data points into clusters.
- K-Means Clustering: Get hands-on with one of the most popular clustering algorithms.
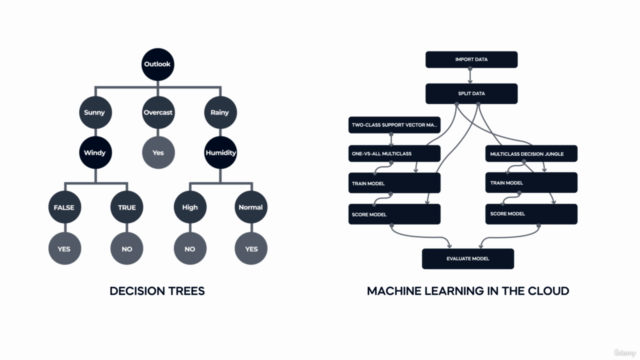
- Decision Trees: Visualize and understand decision boundaries through tree structures.
Core Concepts You Will Learn:
- Regression Coefficients: Interpret the relationship between dependent and independent variables.
- Variability: Measure and control the dispersion of data points.
- OLS Assumptions: Understand Ordinary Least Squares (OLS) and its key assumptions for regression analysis.
- ROC Curve: Grasp the concept of receiver operating characteristic (ROC) curves for evaluating diagnostic tests and classification models.
- Overfitting vs Underfitting: Learn to distinguish between models that are too simple or too complex.
- Classification vs Clustering: Master the difference between categorizing data into predefined classes versus grouping data into clusters based on similarity.
- Choosing Number of Clusters: Discover methods to determine the optimal number of clusters in clustering.
- Clustering Categorical Data: Learn techniques for clustering when your data is categorical rather than numerical.
- Data Standardization: Understand when and why it's necessary to standardize your data before performing certain analyses.
- Pros and Cons of Clustering: Evaluate the advantages and limitations of using clustering algorithms in your analysis.
- Entropy (Loss Function): Learn how entropy measures the impurity of the dataset when creating decision trees.
- Information Gain: Understand how information gain can be used to select the best split for a decision tree.
Why Choose This Course?
- Fundamental Knowledge: Acquire the foundational understanding of machine learning and advanced statistical analysis that will prepare you for more sophisticated tools like Python.
- Practical Application in Excel: Apply your knowledge directly within Excel, a familiar tool, to perform real-world ML tasks.
- Transferable Skills: Build a strong foundation that will serve you whether you choose to continue with Excel or move on to programming languages like Python.
🚀 Ready to embark on your machine learning journey without coding? Click 'Buy Now' and unlock the full potential of data science using Excel! 🛫
Course Gallery


Loading charts...