Excel Charts - Visualization Secrets for Impressive Charts

Why take this course?
🌟 Master Excel Charts with Leila Gharani's Advanced Course! 🌟
Course Title:
Excel Charts - Visualization Secrets for Impressive Excel Graphs for your Management Reports (Excel 2010)
Course Headline:
👉 Gain Highly Advanced Excel Skills 📊 to Create Impressive Excel Graphs for your Management Reports (Excel 2010)! 🚀
What You'll Get with This Course:
This Course Includes:
- 📎 Downloadable Workbook to follow along with demonstrations.
- 📈 Downloadable Exercise Book complete with answers.
- ☝️ Full set of Cheat Sheets for quick reference on creating any of the charts covered in this training.
Transform Your Excel Reports with Advanced Chart Techniques!
Leila's hands-on Excel training is your key to elevating the design and efficiency of your Excel charts, tables, and reports. Dive into the best tricks for dynamic chart creation, save time by automating updates, and wow your audience with enhanced visualization. 🖥️✨
Real Student Feedback:
💡 Lauren says: "I wish Leila had more courses on advanced Excel—especially for Access! The content is highly applicable to my job, and I'm confident it will improve my processes and project turnaround time." 👍
✨ John says: "Leila does an exceptional job of guiding you through the process of creating various charts from scratch. With actual exercises to practice your skills, this course is truly one of the best instructional courses I've ever taken!" 🏅
🔍 Paul says: "The course content is clear and dynamic—absolutely excellent!" 🙌
Explore a Variety of Excel Charts & Graphs:
This course focuses on the types of charts and graphs that are most relevant to corporate reporting, perfect for professionals in controlling, finance, and project management. You'll be well-prepared to create impactful graphs and reports with advanced visualization techniques. 📊💪
For Students & Professionals:
With this course, you'll be fully equipped with the advanced Excel visualization and chart design techniques necessary to make a lasting impression in any professional setting. The demonstrations are done using Excel 2010, but the methods are compatible with various versions of Excel, ensuring your skills stay relevant.
Why This Course Stands Out:
- 🎓 Interactive Learning Experience: Follow along in your own Excel workbook and complete exercises to ensure you understand each concept.
- 🛠️ Dynamic Instruction Style: A blend of screen-casts, talking head, and flip chart demonstrations brings the classroom experience to you.
- 🤝 Clear Communication: Leila's talent for simplifying complex topics will make learning these advanced techniques straightforward and accessible.
Course Breakdown:
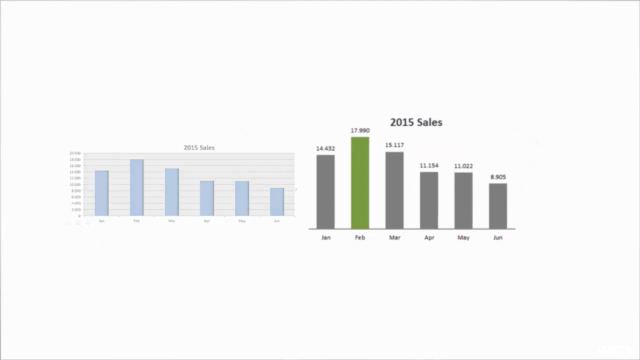
- 📈 Effective Communication & Presentation of Data Trends (with a crash course in best practices for table and graph design)
- 🔄 Behind the Scenes Secrets of Dynamic Charts in Excel (discover key functions to never manually update your charts again)
- ✨ Techniques That Highlight Chart & Table Elements (direct attention where it's most needed)
- 🔊 New Ways to Compare Performance (actual data versus budget, forecasts, and previous year)
- 📊 Effective Chart Combinations (pivotal to management reports)
Embark on your journey to becoming an Excel Chart Master today! With Leila Gharani's Advanced Course, you'll be amazed at how simple these advanced techniques can be. 🌟🚀
Ready to Upgrade Your Excel Skills?
Enroll in Leila Gharani's Advanced Excel Charts Course now and take your data presentation skills to the next level! 📅🎉
Course Gallery


Loading charts...
Comidoc Review
Our Verdict
Excel Charts - Visualization Secrets for Impressive Charts is a comprehensive and engaging resource, designed to sharpen your Excel charting skills, while offering valuable insights and creative techniques. The course will require updating due to its 2016 release, but this does not detract from the vast knowledge within. The instructor’s expertise and clear communication style make this an enjoyable learning experience overall. Just be sure to double-check your Excel version for compatibility before diving in.
What We Liked
- Covers a wide range of advanced Excel charting techniques and best practices for management reports
- Highly detailed, with numerous examples and customizations demonstrated
- Instructor is praised for expertise and clarity in teaching; beneficial for learning both basic and advanced concepts
- Strong practical focus: students learn by doing via provided demo workbook
Potential Drawbacks
- Some content may be slightly outdated, as the course was created in 2016—check Udemy's version compatibility guide
- A few students mention a preference for more recently added Excel chart types, which might not be covered comprehensively
- Minimal overlap found between this and another popular course from the same instructor – still, consider your current skill level before enrolling in multiple courses