Data Visualization: How to Create Dynamic Excel Charts
Why take this course?
📊 Unlock the Power of Data with Dynamic Excel Charts! 🚀
Course Title: Data Visualization: How to Create Dynamic Excel Charts 📈
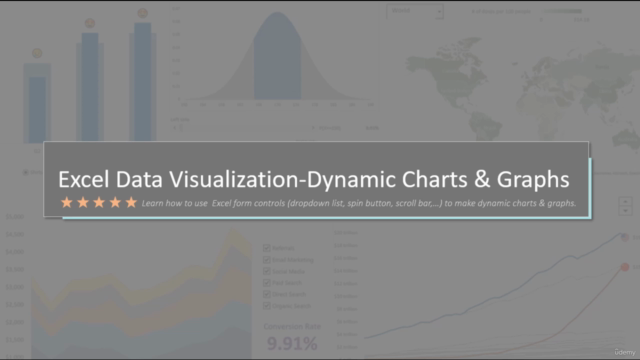
Headline: Learn how to create interactive/dynamic excel charts step-by-step with a comprehensive guide.
Course Description:
Understanding data is crucial in today's data-driven world, and one of the most effective ways to grasp complex datasets is through interactive and dynamic charts. These charts not only make it easier to visualize trends but also save you time by updating automatically as your data changes.
Microsoft Excel is a powerful tool for data analysis, and in this course, you'll harness its capabilities to create charts that are both visually appealing and functional. 🖥️
What You Will Learn:
- Excel's FORM CONTROLS & PivotTable techniques to craft compelling visualizations 🎨
- Data manipulation and analysis methods that will streamline your workflow 🔧
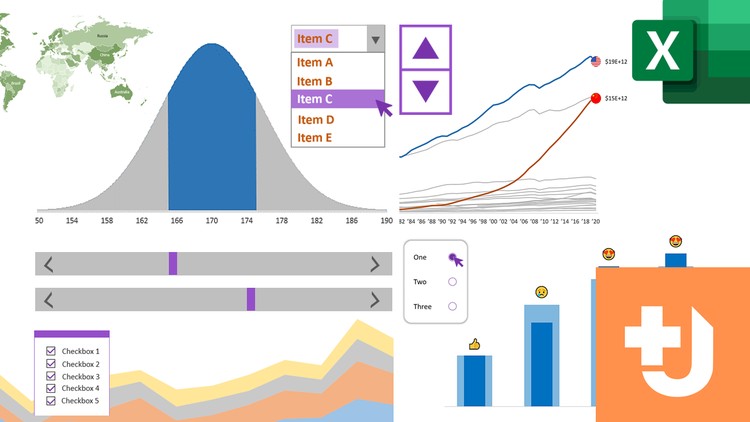
- How to create a Dynamic Chart with Dropdown List, allowing users to switch data series easily.
- Master creating charts with Visual Selecting using Radio Buttons, enhancing user interaction.
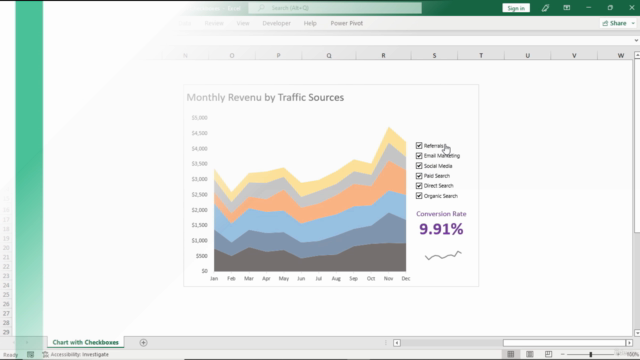
- Implement Multiple Selecting Charts with Checkboxes, enabling users to filter through multiple options simultaneously.
- Animate changes over time in a Change Over Time Chart with Spin Button, adding a dynamic twist to your visualizations.
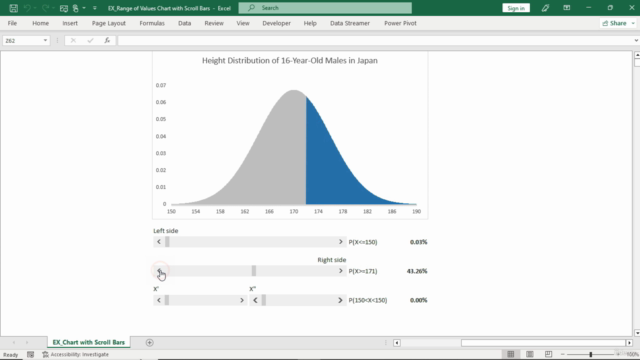
- Utilize Scroll Bars in a Range of Values Chart, providing an intuitive way to interact with your data.
...and there's more! Each technique will be broken down into simple, step-by-step instructions. 🛠️
Why This Course?
- Hands-On Learning: Engage with real-world scenarios that demand dynamic charts.
- Interactive Content: Learn by doing, with exercises designed to reinforce your new skills.
- Expert Guidance: Benefit from the expertise of Datariel Academy's seasoned instructors who are masters in data visualization and Excel.
- Flexible & Convenient: Access the course material at your own pace, from anywhere. 🌍
By completing this course, you will be equipped to:
- Create dynamic charts that can adapt to changes in your dataset without manual updates.
- Present data in an interactive and engaging format, making it more compelling for viewers.
- Become proficient in using Excel's tools to tell a story with your data. 📝
Ready to elevate your data visualization skills? Let's embark on this journey together!
👉 Enroll now and transform the way you interact with data!
Your Instructor:
- Dataklinic Academy brings years of expertise in data analysis and Excel mastery to the table. We are committed to providing you with the most comprehensive and practical learning experience possible. 🏅
Let's dive into the fascinating world of data visualization and make your charts come alive with Datariel Academy's "Data Visualization: How to Create Dynamic Excel Charts" course! 🎉
Course Gallery
Loading charts...