Microsoft Data Analysis using Excel Pivot Tables & Charts

Why take this course?
🚀 Master Microsoft Data Analysis with Excel Pivot Tables & Charts in Just 5 Hours! 📊✨
Welcome to the Ultimate Guide for Excel Power Users!
In this comprehensive Microsoft Excel - Data Analysis using PivotTables & Charts Course, we dive deep into the world of data analysis, transforming raw data into insightful reports and interactive dashboards with ease. 💻✨
Why Choose This Course?
- Efficient Data Analysis: Learn how to perform complex data analysis tasks quickly and efficiently within Excel, the most widely used data analysis tool globally. 🌍
- Practical Skills: Gain hands-on experience with Pivot Tables, Charts, and Dashboards that will elevate your data analysis game. 🎯
- Real-World Applications: Understand the practical use of data analysis in business decisions with real-time industry data. 🏢
- In-Depth Coverage: From beginner to advanced, this course takes you through every aspect of Excel's Pivot Tables and Charts. 🚀
Course Highlights:
✅ Understand the Basics:
- Learn about Excel functions and how they integrate with Pivot Tables.
- Get familiar with sorting, filtering, and grouping tools.
✅ Master Advanced Techniques:
- Explore advanced Pivot Table Grouping options (text, number, dates).
- Discover how to chart and graph data trends effectively.
- Uncover the latest Excel Pivot Hacks and tricks.
✅ Dive into Power Features:
- Utilize Pivot Table Options to enhance your data analysis capabilities.
- Implement Conditional Formatting within Pivot Tables for better data visualization.
- Master the GETPIVOTTABLE Formula to maintain flexibility in your pivots.
✅ Create Interactive Dashboards:
- Learn how to create compelling reports with "Report Filter Pages".
- Integrate Slicers and Timelines for an interactive user experience.
Course Structure:
📈 Getting Started with Pivot Tables:
- Understand the structure of raw data in Excel.
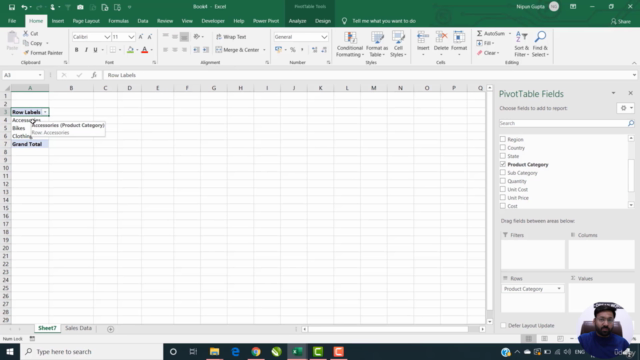
- Create your First Pivot Table from scratch.
- Explore different layouts and styles available.
🎨 Design and Formatting:
- Discover design options to enhance the appearance of your Pivot Tables.
- Apply formatting tools for a professional look.
🔄 Data Manipulation:
- Use sorting, filtering, and Grouping tools to tailor your data analysis.
- Create Calculated Fields, Items, and Values to uncover new insights.
📊 Advanced Pivot Table Features:
- Explore the power of "Report Filter Pages" for detailed analysis.
- Learn about Pivot Charts, Slicers, and Timelines for dynamic data visualization.
What's Included?
- Practice Files: Real-world datasets to practice your skills.
- Assignments and Case Studies: Apply what you learn with practical tasks.
- E-Book Guide: A supplementary resource to help you follow along with the course videos. 📚
Your Instructor:
Learn from a seasoned professional at Trulabz Technologies who specializes in making complex data analysis accessible and easy to understand with Excel's powerful tools. 👩💻
Ready to Transform Your Data Analysis Skills?
Enroll now and unlock the full potential of Microsoft Excel with Pivot Tables and Charts! 🚀📈
FAQs:
-
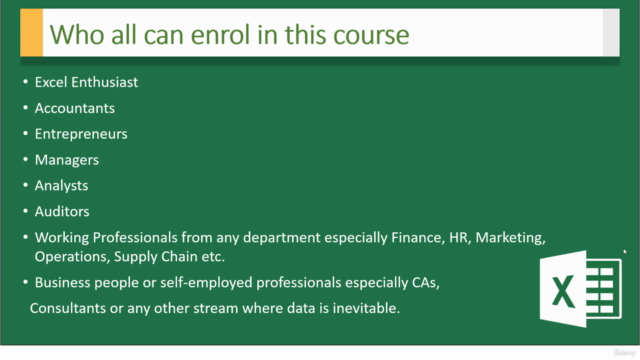
Do I need prior knowledge of Excel? No, this course is designed for all levels. We'll start from the basics and build up your skills.
-
How long do I have access to the course? Once enrolled, you'll have unlimited access to this course for as long as you like - across any and all devices. 💻
-
Are there assignments or projects? Yes! This hands-on course includes assignments that allow you to practice your new skills with real data sets.
Join us on this transformative data analysis journey with Excel Pivot Tables & Charts - Your gateway to making smarter, data-driven decisions! 🌟💪
Course Gallery


Loading charts...