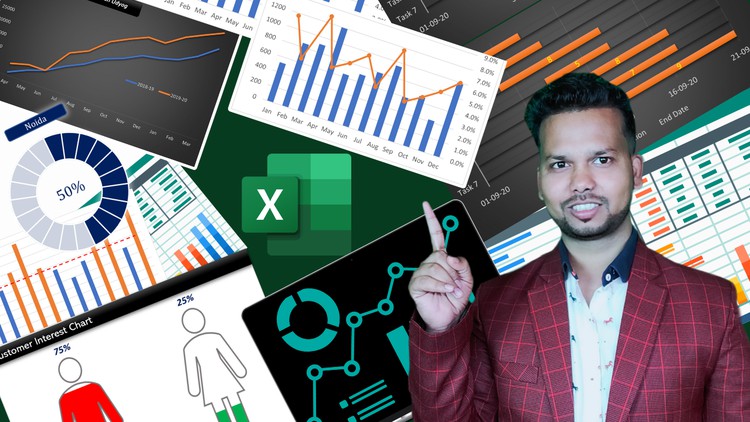
Microsoft Excel Dashboard, MIS and Data Analysis Masterclass

Why take this course?
🎉 Master Excel Data Analysis: Dynamic MIS Reports, Dashboards | Pivot Tables, Gantt Charts 📊
Course Overview:
Excel Data Analysis Mastery: Dynamic MIS Reports & Dashboards is a comprehensive course designed to transform you into an Excel data analysis expert. With hands-on learning and practical exercises, you'll master the creation of dynamic Management Information System (MIS) reports and captivating dashboards using the full suite of Excel tools. 🛠️
What You'll Learn:
📈 Pivot Table & Chart Mastery:
- Understand and apply advanced Pivot Table functionalities to summarize data effortlessly.
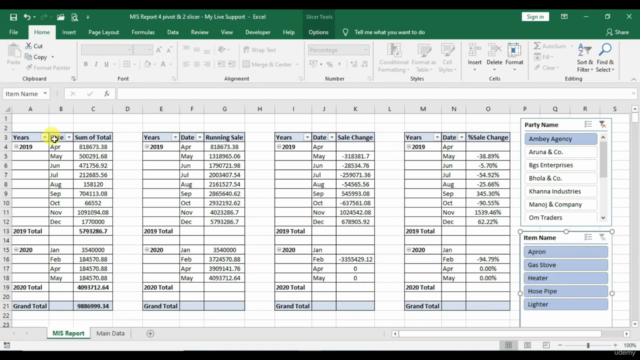
- Create interactive, meaningful charts from your Pivot Tables that bring your data to life.
🔄 Slicer Customization:
- Learn how to use Slicers to filter and organize your data interactively.
- Discover tips for creating a Search Box in Slicer Function to enhance user experience.
📚 Creating Pivot Tables from Multiple Sheets:
- Master the technique of combining data from multiple sheets into a single, cohesive Pivot Table.
👀 Dashboard Design & Optimization:
- Elevate your dashboard design with Conditional Formatting that highlights key data points.
- Transfer data efficiently from the Master Sheet to Multi Sheets and present your findings with insightful Sparklines, Gantt Charts, and Comparison Charts.
📱 Info Graphics & Visual Storytelling:
- Explore the creation of visually impactful Info Graphics such as Male-Female Charts and Thermometer Charts.
- Learn how to save all your charts as images and present them in a professional manner.
📈 Trends Arrows & Progress Circle Charts:
- Dive into the dynamic landscape of creating Trends Arrows for visualizing data trends.
- Craft Progress Circle Charts that provide an instant snapshot of progress or performance.
Why Take This Course?
- Real-World Applications: Learn practical skills applicable across industries for MIS reports and business dashboards.
- Enhanced Data Interpretation: Gain the ability to interpret complex data sets and communicate your findings clearly.
- Professional Growth: Demonstrate advanced Excel proficiency, making you an invaluable asset to any team.
- Interactive Learning: Engage with interactive content that makes learning fun and effective.
Practice File Included:
Get your hands on real data with a practice file provided as part of the course materials. Put your new skills into action and start creating dynamic MIS reports and dashboards immediately!
Ready to elevate your Excel data analysis game? 🚀 Enroll in "Excel Data Analysis Mastery: Dynamic MIS Reports & Dashboards" today and transform the way you handle data! 📈✨
Course Gallery


Loading charts...