HR Analytics - Build Dynamic Excel Dashboard from Scratch
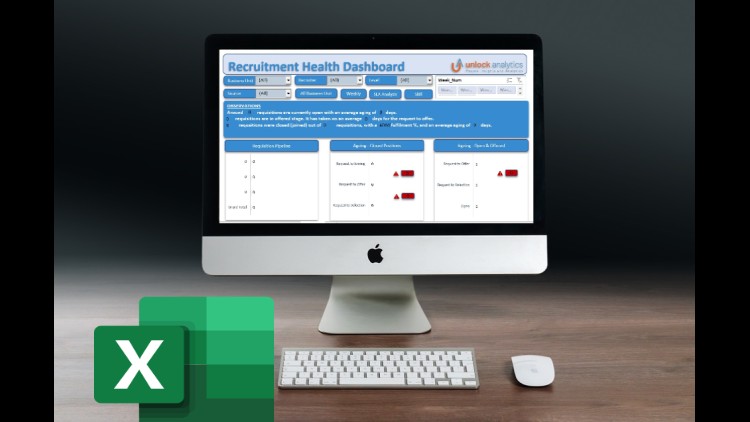
Why take this course?
🌟 Course Title: HR Analytics - Build Dynamic Excel Dashboards from Scratch
🚀 Headline: Create Eye-Catching, Dynamic, Interactive Microsoft Excel Dashboards
Course Description:
Are you ready to transform the way you handle HR analytics? 📊💼 In this course, we're diving into the world of data visualization and analysis using everyone's favorite tool: Microsoft Excel! 🖥️
Why Excel? Excel is more than a spreadsheet application. It's a powerful analytics tool that's accessible to virtually anyone with basic computer skills. Its widespread use across industries makes it an ideal platform for creating dynamic and interactive dashboards without the need for complex software like Tableau or Power BI.
🕒 Learn in Less Than 2 Hours! That's right! You'll learn to create a comprehensive, interactive dashboard from scratch in under 2 hours. Imagine impressing your manager with an advanced tool that could significantly impact your performance evaluation and potentially land you a well-deserved bonus.
Purpose of Dashboards: Dashboards are crucial for both operational and analytical purposes:
- Operational Dashboards: Provide a snapshot of current performance, offering a high-level view without the need for extensive drill-downs.
- Analytical Dashboards: Utilize historical data to identify trends that can inform future decisions.
Course Highlights:
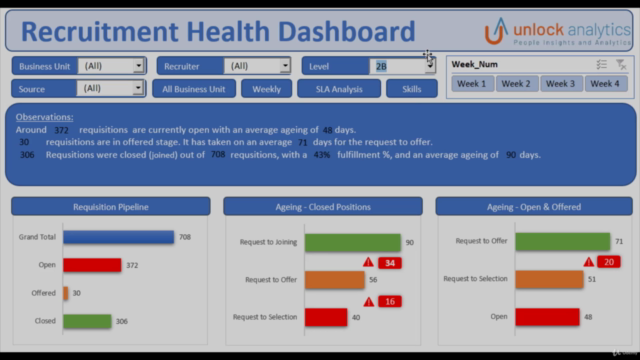
- Real-World Application: We'll focus on a key HR metric, "Time to Hire," and visualize its various stages, enabling you to filter data by week, sourcing channel, and skill level. 🛠️
- Efficiency Insights: Analyze recruiters' efficiency and identify which business units may be experiencing delays in the hiring process.
- Anatomy of a Dashboard: We'll break down the components of an interactive dashboard, making it easier for you to build your own, tailored to any business challenge. 🧪
What You'll Learn:
- Data Visualization Techniques: Master Excel functions and features that bring your data to life.
- Interactive Elements: Create charts, graphs, and sliders that allow users to interact with the dashboard.
- Dynamic Data Handling: Learn how to update your dashboard automatically as data changes.
- Efficient Problem Solving: Use a step-by-step approach to tackle any business problem using dashboards.
By the end of this course, you will have:
- A fully functional, interactive HR analytics dashboard in Excel.
- The skills to analyze and visualize HR data effectively.
- The ability to present your findings in a clear, engaging manner.
- A competitive edge in your career by adding this valuable skill set to your resume.
Don't let complex software hold you back from leveraging the power of analytics. Join us now and start building interactive dashboards that will make a tangible difference in your HR role! 🚀📈
Enroll Today and Unlock the Potential of Your Data with Excel! 🎉
Unlock the full potential of your HR data with our comprehensive, hands-on course designed to empower you with the skills to create dynamic, interactive dashboards in Microsoft Excel. Whether you're looking to enhance operational efficiency or make informed analytical decisions, this course will provide you with the tools and knowledge to succeed. 📈🎓
Course Gallery
Loading charts...