Create Advanced Excel Dashboard: Single Sheet Analytics

Why take this course?
👩🚀 Transform Your Data into Actionable Insights with Advanced Excel Dashboard Mastery!
🌟 Hear from Our Satisfied Learners:
- "I've been thoroughly impressed with the course structure, especially the concise and highly relevant short videos that keep my attention sharp. The exclusive insights on shortcuts are truly a rarity in other courses." – Peter Klugsberger, Australia, ex-McKinsey & Co., served various senior roles (CEO, COO).
- "The course content was almost tailor-made for my exact needs at the office. It's like Yoda solved a galactic puzzle with your finance data!" – Rajesh Dhoot, India, ex-Sr. Manager, Finance and Accounts, Ultratech Cements.
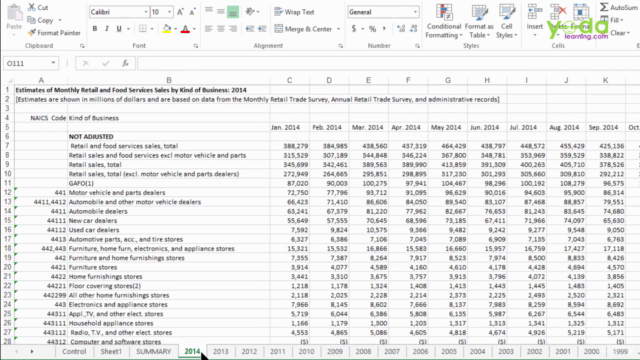
🎓 Course Overview: We delve into 9 comprehensive videos, each approximately half an hour long, guiding you through the process of creating a dynamic dashboard for Excel Analytics. Learn how to construct a single sheet tracker capable of pulling data from multiple sources and present it in a cohesive and insightful manner.
📊 What You Will Master:
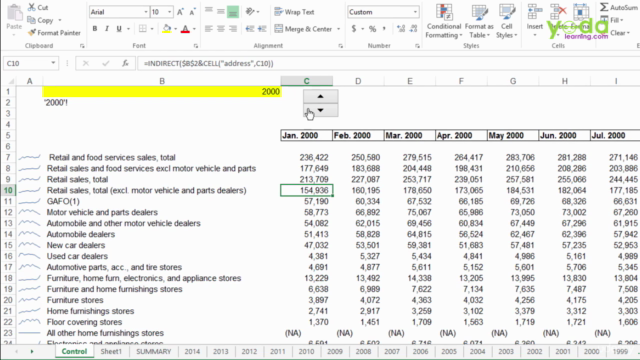
- INDIRECT, CELL, CONCATENATE ($) functions to manipulate and pull data dynamically.
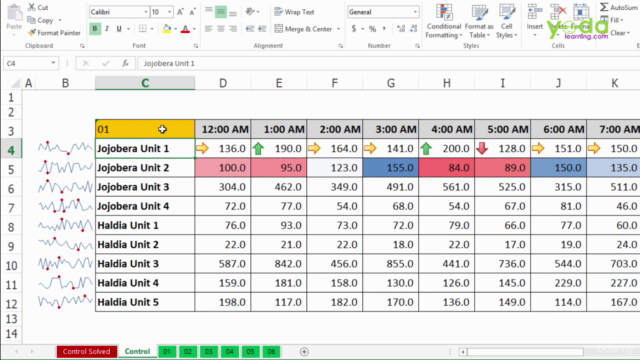
- Utilizing Spin buttons, sparklines, and Drop down lists to enhance your dashboard's interactivity and visual appeal.
- Crafting a single sheet tracker for various applications, including finance and operations.
📈 Real-World Applications:
- Create a financial dashboard that updates automatically as data changes.
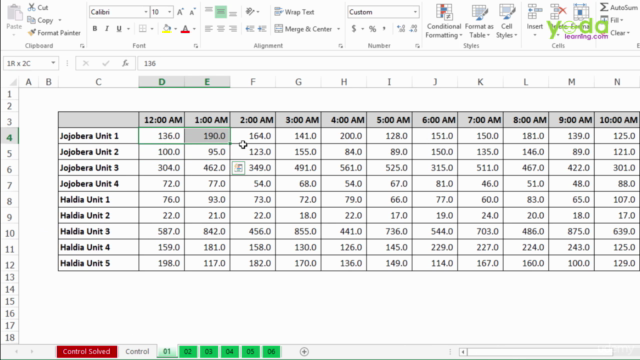
- Manage inventory or production tracking on a single sheet, with dynamic range references.
- Visualize sales data with interactive charts and graphs for better decision-making.
👍 What You Won't Find Elsewhere:</ Unlike other courses that focus heavily on Pivot Tables, Sort & Filter, and Vlookup, this course is dedicated to teaching you the art of creating a single sheet tracker dashboard using specific functions and features in Excel.
💌 Your Investment Includes:
- Unlimited, lifetime access to the course content.
- Free updates and new content added to the course.
- Full support from me throughout your learning journey.
- Over 20 guided practice worksheets for immediate application of skills learned.
- Access to all videos 24x7, so you can learn at your own pace, anytime, anywhere.
- A 30-day money-back guarantee to ensure your complete satisfaction.
🏆 Join the League of Excel Experts: Don't miss this opportunity to elevate your data handling skills and become an Excel Ninja! With just half an hour of investment, you can unlock a world of possibilities with advanced Excel dashboard creation. 🚀
🎉 Next Steps: Take the leap and join this exclusive course. Elevate your data management game, impress your peers, and unlock the full potential of Excel! Enroll now and embark on your journey to becoming an Advanced Excel Dashboard Master! 🎉
Course Gallery


Loading charts...