Excel Crash Course: Dashboards, Data Analysis & Heatmaps

Why take this course?
🎉 Excel Crash Course: Dashboards, Data Analysis & Heatmaps 📊💻
Supercharge your Microsoft Excel skills rapidly! 🚀
This is a 100% project-based Microsoft Excel crash course with a special focus on data analysis, designing simple dashboards, and creating heatmap visuals and other charts. Maximizing office productivity is a key skill to learn, and by working with modern Excel tables and learning how to extract insights from data, you'll achieve a leap in your Excel skills in just 3 hours! 🕒
Course Overview:
Why Excel skills matter 🧐
Advanced Microsoft Excel skills can open up a plethora of career opportunities across various industries, including finance, consulting, manufacturing, pharmaceutical, analytics, and beyond. As a skilled Excel user capable of extracting insights from data, you'll be comfortable working in numerous business roles. Excel is the primary tool for financial modelling and ad-hoc data analysis, making it an essential skill in today's data-driven world.
Course Structure: 📚
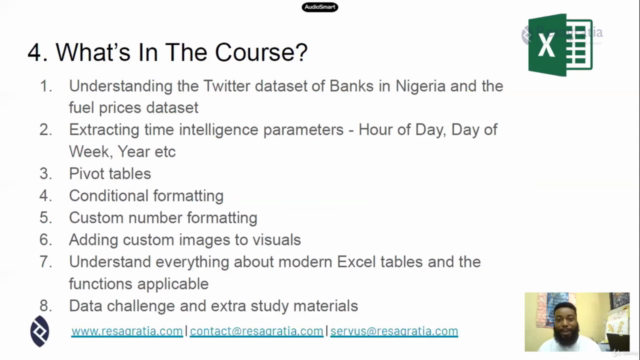
The course curriculum is designed as a project-based, crash course. You will dive into working with Twitter data and fuel prices data to design dashboards and extract insights using Pivot Tables. The course builds on itself, ensuring that the concepts from earlier sections are reinforced as we progress. It's composed of 18 short lectures, two problem-solving sessions, and over 1 hour of practice problems with detailed real-life analytical scenarios.
What You Will Learn:
✅ Explore Excel from a data science perspective
✅ Design three dashboard systems in Excel: Twitter Activity Heatmap, Advanced Currency Converter, Business Invoicing Dashboard
✅ Manipulate pivot tables to create effective and beautiful charts and heatmap visuals
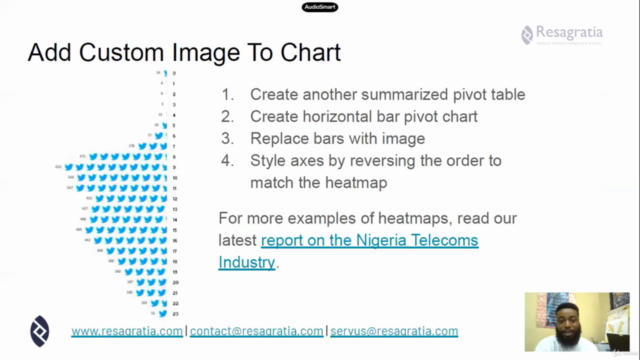
✅ Customize pivot charts with custom images
✅ Use Power Query to manipulate and mashup data
✅ Master certain tips and tricks to fine-tune your Excel dashboards and visuals
✅ Work with text functions for detailed data analysis
✅ Test your data analysis skills using Twitter API
✅ Learn how to maximize office productivity and increase your salary with automation skills
Course Requirements: ⚙️
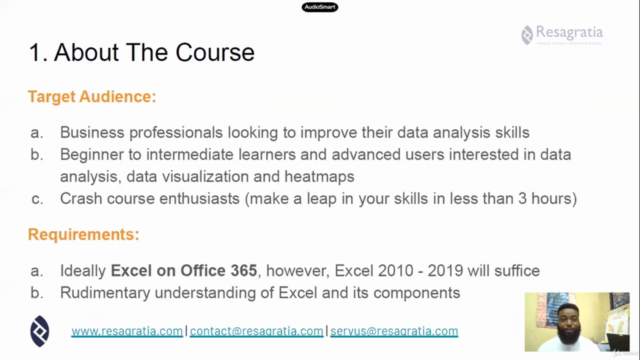
- Excel on Office 365 for Windows (preferred)
- Mac users also welcome, but note the Pivot Table interface differences
- Basic reporting knowledge in Excel is a plus but not required
- A willingness to take a leap and learn in a crash course format!
Who This Course Is For: 👥
- Beginners in Excel interested in mastering data analysis
- More advanced users looking to enhance office productivity with Excel
- Business students intrigued by data visualization
- Business professionals eager to delve into data analysis and modelling
- Crash course enthusiasts who love learning new skills quickly
- Python developers and coders curious about integrating Excel into their data analysis workflow
Get ready to embark on an exciting journey with Excel, where you'll turn data into insights! 🌟 With hands-on practice, real-world datasets, and a comprehensive learning experience, this course is designed to make you proficient in Excel dashboards and data analysis. Plus, upon completion, you'll receive a verifiable certificate of completion to showcase your new skills! Let's dive into the world of data with confidence and expertise. 🔢✨
Course Gallery


Loading charts...