Excel PivotTables: Master Data Analysis and BI

Why take this course?
🚀 Course Title: Excel Building BI with PivotTables
🎓 Headline: Excel Building BI with PivotTables - Unleash Your Data's Potential!
👨🏫 Instructor: Ken Puls, your go-to Excel guru and data analysis wizard.
🚀 Course Description:
Are you ready to elevate your skills in Excel and become a master of business intelligence with PivotTables? Our course, "Excel Building BI with PivotTables," is the ultimate guide designed to turn you into an Excel pro. With a focus on hands-on learning and real-world applications, this course will help you navigate the complexities of Excel's advanced features and harness their power for effective data analysis and reporting.
🔍 What You Will Learn:
-
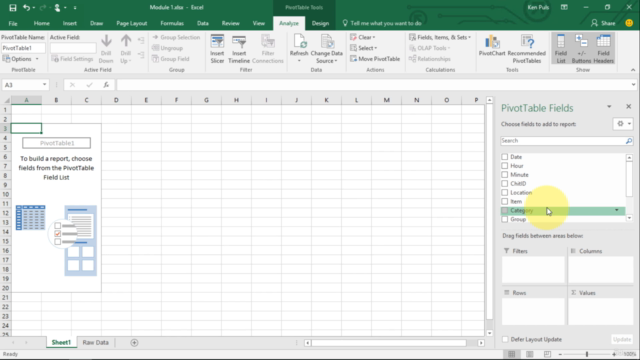
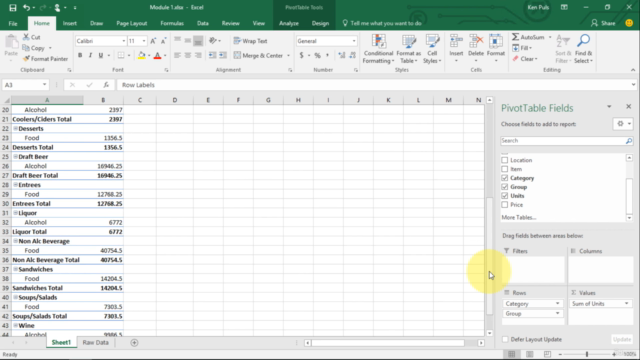
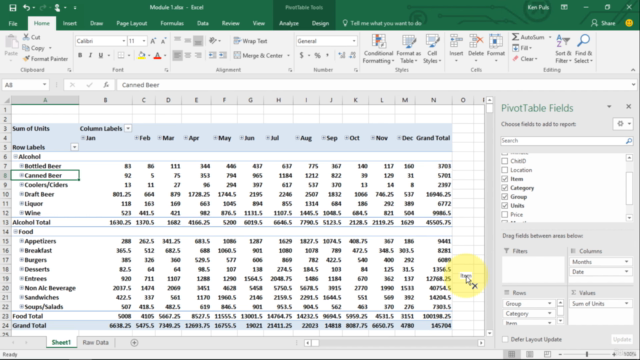
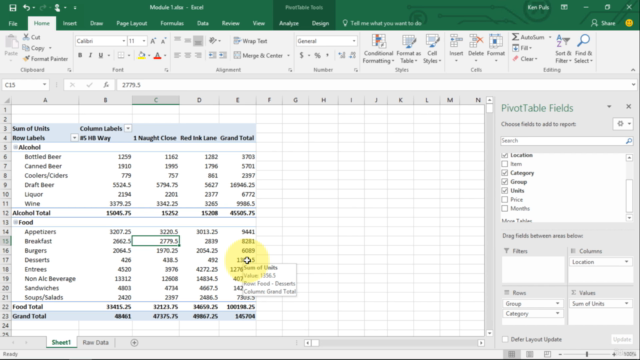
Understanding PivotTables: Discover how to create robust, interactive tables that summarize large datasets with ease.
-
Data Analysis Techniques: Explore advanced techniques to analyze trends, outliers, and patterns in your data.
-
Practical Application: Learn how to apply your new skills to real-world business scenarios, tracking KPIs, identifying trends, and forecasting outcomes with Excel confidence.
-
Automated Reports: Master the art of constructing dynamic reports that update automatically as your source data changes.
💡 Key Takeaways:
-
Expert Guidance: Follow along with Ken Puls, a recognized authority in Excel and a passionate teacher who will demystify complex processes.
-
Hands-On Learning: Engage with the course material through practical exercises designed to reinforce your understanding of PivotTables and their applications.
-
Enhanced Efficiency: Streamline your data analysis process, saving time and improving accuracy.
-
Data-Driven Insights: Gain the ability to extract meaningful insights from a mountain of data, supporting better business decisions.
👩🎓 Why You Should Take This Course:
-
Practical Skills for Real-World Impact: This course is tailored to give you the skills and knowledge to manage and analyze data effectively.
-
Comprehensive Learning Path: From introductory concepts to advanced techniques, our course structure ensures a smooth learning curve.
-
Empowerment Through Excel: Gain the confidence to manipulate and analyze large datasets with the touch of a button.
-
Community of Learners: Join a network of professionals just like you who are dedicated to improving their Excel skills and driving business success.
By the end of this course, you'll not only have a deeper understanding of how to leverage Excel's powerful PivotTables but also be armed with the tools to become an influential part of your organization's data analysis journey. 📊🌟
🎯 Course Objectives:
-
Master the creation, customization, and management of PivotTables in Excel.
-
Learn the best practices for data analysis using Excel.
-
Develop the skills to create automated reports and dashboards that provide instant insights.
-
Apply your newfound knowledge to enhance business decision-making processes.
📆 Enroll Now and Transform Your Approach to Data Analysis! 🚀
Don't wait to become Excel proficient. Enroll in "Excel Building BI with PivotTables" today and build a foundation for data analysis that will last a lifetime. Let Ken Puls guide you on this journey towards becoming an Excel superstar! 🖥️✨
Course Gallery


Loading charts...