Excel Power Map: A Power BI Tool for Reporting Professionals

Why take this course?
🌟 Master Excel Power Map with Confidence! 🌟
Course Instructor: Kawser Ahmed
A Data Visualization Maestro with a Passion for Teaching
Kawser has dedicated his expertise to teaching Excel and Data Analysis, boasting an impressive portfolio. His blog, ExcelDemy.com, attracts over 11,000 visitors every month. With a staggering number of 15,000+ successful students since November 2015 and a total of 375 reviews, Kawser's online courses are a testament to his mastery and the value he provides in the realm of data analysis.
Course Title: Excel Power Map: A Power BI Tool for Reporting Professionals
Transform the way you handle data with Excel Power Map, a captivating tool within Power BI that enables you to visualize your data in three dimensions like never before. This course will revolutionize how you approach reporting and analytics by introducing you to the world of 3-D data visualization.
Course Headline: Unlock New Perspectives with Excel Power Map
Dive into the realm of dynamic data storytelling and discover patterns and insights that elude traditional 2-D charts. With Excel Power Map, you'll be able to plot vast amounts of geographic and temporal data on a 3-D globe or custom map, bringing your data to life over time.
Course Description:
Welcome to the world of Excel Power Map, where your data takes center stage in an immersive, visual narrative. This course, updated on Nov 01, 2016, is designed to empower you with the skills to harness Excel’s 3-D data visualization tool and elevate your reporting game.
By the end of this comprehensive course, you will have mastered the art of:
-
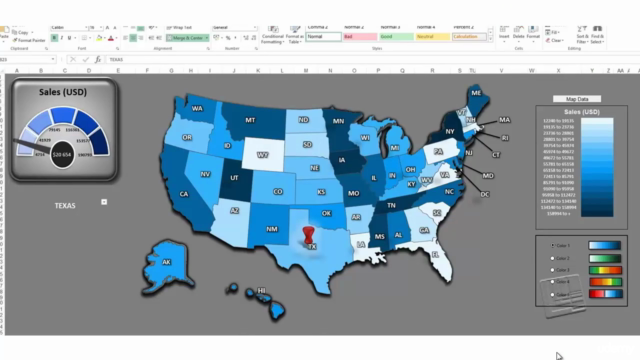
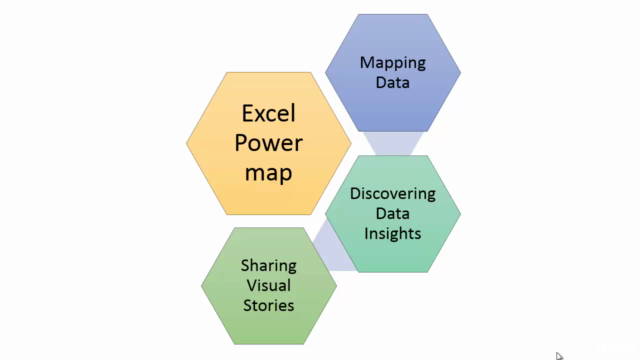
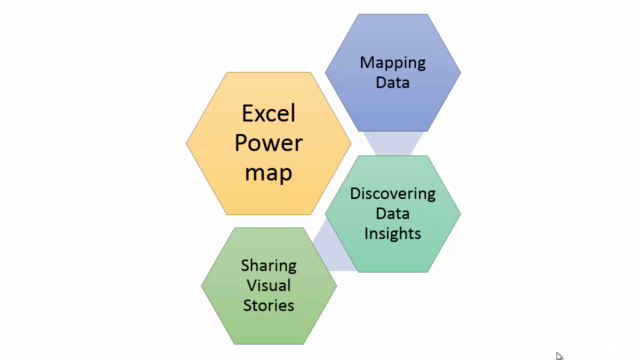
Mapping Data: Visualize more than a million rows of data on Bing maps in 3-D format from an Excel table or Data Model in Excel.
-
Discovering Data Insights: Gain new perspectives by viewing your data in geographic space and witness the evolution of time-stamped data over time.
-
Sharing Visual Stories: Create engaging, cinematic video tours from your data visualizations and share them with a broad audience, or export these tours to video for sharing in different formats.
Why Take This Course?
This course is an essential tool for professionals who frequently create reports and presentations. Excel Power Map serves as an extremely powerful reporting tool that can help you identify sales trends, customer patterns, and other insights critical to informed decision-making within your company.
Acquiring the expertise in Excel Power Map will not only enhance your current skillset but also open new avenues for impactful data presentation. By completing this course, you'll be well-equipped to create compelling visual stories that will captivate and inform any audience.
Thank You!
Thank you for considering Excel Power Map: A Power BI Tool for Reporting Professionals. Join thousands of others who have transformed their data presentation skills with this powerful tool. Embark on a journey to become a master storyteller through your data, and make an impact within your professional circles.
Enroll now and begin your journey towards becoming an Excel Power Map pro! 🚀📊✨
Course Gallery


Loading charts...