Microsoft Excel: Essential Statistics for Data Analysis

Why take this course?
🌟 Microsoft Excel: Essential Statistics for Data Analysis 🌟
Course Description
Overview
This is a hands-on, project-based course designed to help you master essential statistics concepts for data analysis and business intelligence. Whether you have a background in math or stats or not, this course will simplify and demystify the use of statistics within Excel.
Who is this for?
- Data Analysts
- Data Scientists
- Business Intelligence Professionals
- And anyone looking to make data-driven decisions with confidence!
What You'll Learn
With a focus on practical application, this course will guide you through the following projects:
-
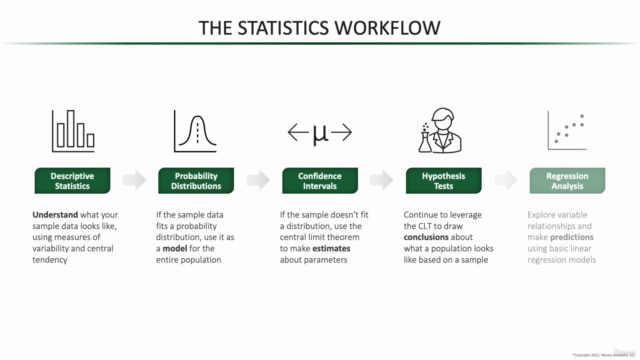
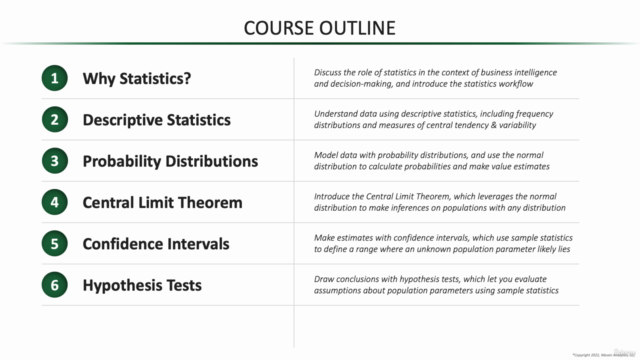
Confidence Intervals & Sampling Distributions
- Explore the concept of confidence intervals and how they provide a range where population parameters likely fall. 📈 Project: Analyzing customer data for a pharmaceutical company.
-
Hypothesis Testing & P-Values
- Learn to draw conclusions about population parameters using sample statistics with hypothesis testing and understand the role of p-values in decision making. 🎯 Project: Assessing safety performance for a major airline.
-
Regression Analysis Fundamentals
- Understand how regression analysis can estimate the value of a dependent variable based on the relationship with one or more independent variables. 📊 Project: Predicting flight delays using historical data.
-
Statistical Significance & Effect Size
- Discover the importance of not just determining if findings are statistically significant, but also the magnitude of the effect. 🔍 Project: Evaluating the effectiveness of safety protocols for a safety council.
-
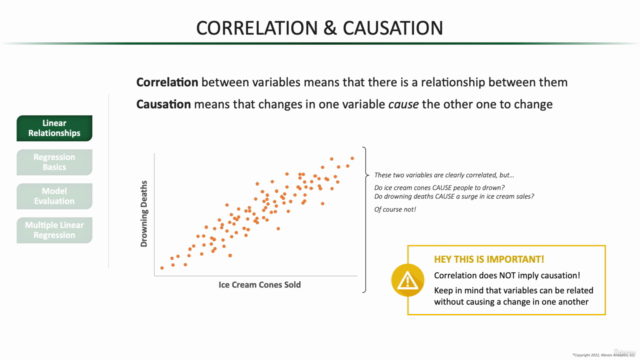
Correlation vs. Causation
- Learn to distinguish between correlation and causation, and understand how to correctly interpret data relationships. 🤝 Project: Examining the relationship between customer satisfaction scores and retention rates.
What's Included?
- 7.5 hours of high-quality video content.
- A comprehensive Statistics for Data Analysis PDF ebook (150+ pages).
- Downloadable Excel project files and solutions for hands-on learning.
- Access to an expert support forum for questions and assistance.
- A 30-day Udemy satisfaction guarantee.
Why Choose This Course?
- Led by Enrique Ruiz, a Lead Statistics & Excel Instructor at Maven Analytics.
- Practical, real-world examples and projects to apply your new skills immediately.
- Join a community of learners with shared interests in data analysis and Excel.
Student Testimonials
- "Wow, Excel is capable of that? It's amazing! I can't wait to dive into the other courses!" – Judit B.
- "Excellent material that I apply to my daily use of Excel. As an Excel professional, I picked up dozens of new tips and techniques. Wonderful course, well-presented and well-explained." – Robert C.
- "At the first part I just said to myself, 'This guy is doing magic!', and now I feel like I'm capable of doing the same. I loved all of it!" – Jeffrey P.
Additional Resources
- Explore our full course library from Maven Analytics, offering courses in Excel, Power BI, SQL, Tableau, Python, Alteryx, and Machine Learning.
Join us today to start your journey into the world of data analysis with statistics and Excel! 🚀
Enrique Ruiz
Lead Statistics & Excel Instructor, Maven Analytics
Ready to take the next step in your career? Enhance your skill set with our comprehensive course on Essential Statistics for Data Analysis. Get immediate lifetime access and transform the way you approach data analysis using Excel. 📊✨
Course Gallery


Loading charts...
Comidoc Review
Our Verdict
Microsoft Excel: Essential Statistics for Data Analysis offers a comprehensive approach, transforming traditional statistics education by incorporating real-world examples and practical exercises. While some areas might benefit from further explanation or adjustments in pacing, the course's strengths lie in emphasizing interpretation and application of fundamental statistical concepts. Enhance your data analysis skills with this insightful and engaging learning experience.
What We Liked
- The course excels in emphasizing the interpretation of statistical concepts rather than just focusing on formulas, making it easy for learners to grasp the essence of statistics.
- Examples and exercises using Excel formulas enable critical data analysis before drawing conclusions, enhancing practical skills.
- In-depth exploration of essential topics like t-distributions, confidence intervals, and regression models prepares learners for real-world applications.
- Frequent quizzes, challenges, and instructor-led solutions promote better understanding and conceptual thinking during the learning process.
Potential Drawbacks
- Some learners might find the lack of extensive use of normal distribution graphs in explaining confidence intervals confusing.
- Pace can be overwhelming for those seeking a more gradual introduction to certain topics, such as hypothesis testing.
- The course is denser than its advertised duration, making it challenging for learners to complete within the suggested timeframe.
- Expanding on concepts introduced towards the end of the course may help increase understanding and direct applicability.