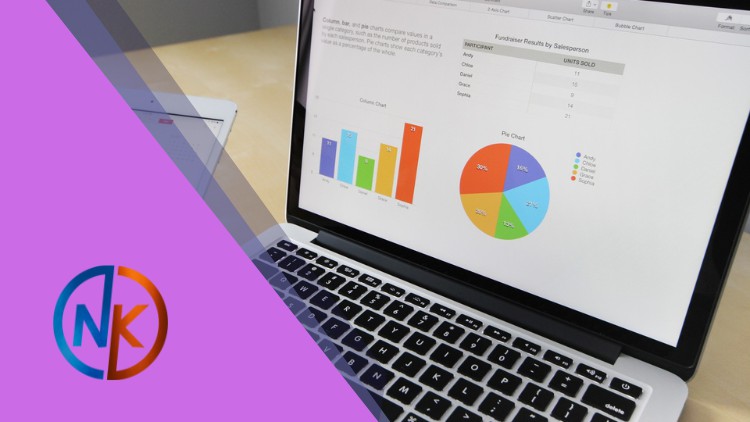
Mastering Data Visualization & Analytics with MS Excel

Why take this course?
🌟 Complete Course in Data Visualization & Analytics: Advanced Microsoft Excel 2016+ 🚀
Headline: Advanced Microsoft Excel 2016+ Course 📊 - Mastering Data Analysis and Data Visualization for Success!
Description: In today's data-driven world, success hinges on your ability to analyze and visualize data effectively. A whopping 70% of our achievements depend on what we do, while a compelling 30% lies in how we market our work. That's 100% of your success potential right there! Our Advanced Microsoft Excel 2016+ Course is meticulously designed to cover the critical aspects of Data Cleaning, Data Preparation, Data Analysis, and Data Visualization – the very foundation you need for that 30%.
With this course, you'll unlock the power of over 120+ Formulas / Functions and chart types within Excel 2016+. You'll dive deep into advanced techniques and tools like PivotTables, Lookups, Logical Formulas, automated dashboards, and more. Plus, you'll enjoy LIFETIME access to all course materials – including videos, datasets, quizzes, projects, exercises, and personalized expert support.
Course Methodology: 📚 The course is structured into four comprehensive steps:
- Data Cleaning: Learn the initial stages of data management where you prepare your raw data for analysis.
- Data Preparation: Gain proficiency in structuring and organizing your data efficiently.
- Data Analysis: Master advanced methods of hypothesis testing, forecasting, and statistical analysis to extract meaningful insights from data.
- Data Visualization: Create compelling dashboards and visualizations that tell a story with just a glance.
What You'll Learn: 🎓
- Communicate complex data insights in just 10 seconds.
- Become a pro at using advanced tools such as PivotTables and Pivot Charts.
- Master advanced data analysis techniques, including hypothesis testing and forecasting.
- Craft impactful dashboards that can influence decision-making.
- Explore different chart and graph types to visualize data effectively in Excel.
Who This Course Is For: 👥
- Aspiring or current professionals aiming to master MS Excel for Data Analysis and Visualization.
- Individuals looking to gain recognition and possibly receive a promotion by effectively showcasing their achievements through data.
- Students undertaking Summer Internship Projects who want to stand out with their reports.
- Existing Excel users who wish to enhance their skills with advanced charts, graphs, and dashboards.
- Students seeking an engaging, hands-on, and highly interactive approach to learning.
- Anyone considering a career in data analysis or business intelligence.
Course Requirements: 📝
- A Laptop/PC with any version of Excel installed (Excel 2016+ recommended).
- Basic understanding of common Excel operations (open, close, save a file).
Embark on this journey to transform your data into compelling narratives that can drive your career forward. With the Advanced Microsoft Excel 2016+ Course, you're not just learning; you're equipping yourself with tools for a lifetime of success and innovation in data analysis and visualization. Enroll now and take the first step towards becoming an expert data analyst!
Loading charts...