Rhino Grasshopper - HUMAN UI plugin for Data Visualization

Why take this course?
🌱 Unlock the Potential of Your Data with Rhino, Grasshopper & Human UI! 🚀
Course Title: Rhino Grasshopper - HUMAN UI Plugin for Data Visualization
Headline: Dive into the World of Interactive Data Visualization with Grasshopper & Rhino, Enhanced by Human UI!
Course Description:
Embark on a journey to transform your data visualization projects with the powerful combination of Rhino, Grasshopper, and the innovative HUMAN UI plugin. This course is designed to elevate your skills in creating interactive and dynamic graphical interfaces that bring complex datasets to life. 🖥️✨
With HUMAN UI, you can seamlessly bridge the gap between intricate Grasshopper scripts and users who may not be familiar with the underlying computational tools. This plugin is a game-changer for architects, designers, and engineers looking to present their work in a more digestible and engaging manner.
What You'll Learn:
- Mastering HUMAN UI Logic: Gain an intuitive understanding of how HUMAN UI operates within your Grasshopper definitions. 🧠
- Harnessing HUMAN UI Tools: Discover the essential tools provided by HUMAN UI and learn how to apply them effectively in your projects. ⏫
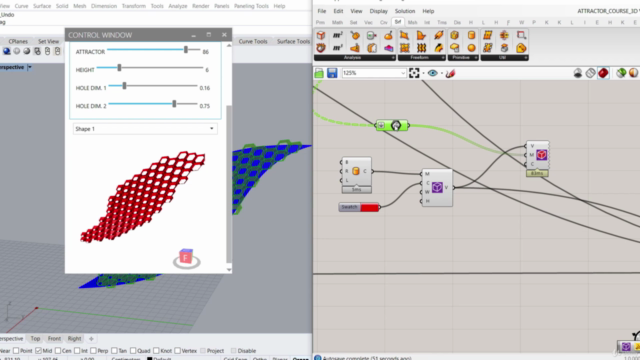
- Customizable Graphical Interfaces: Create interfaces that are not only functional but also tailored to your specific needs and design aesthetics. 🎨
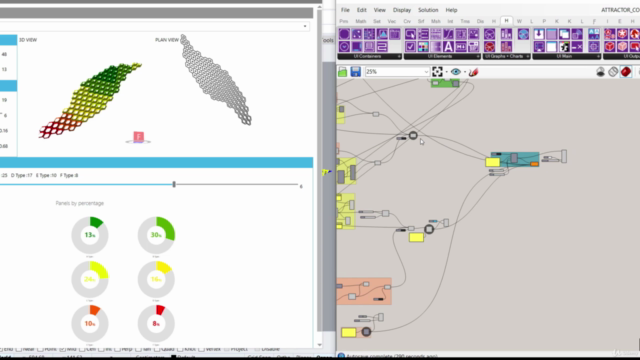
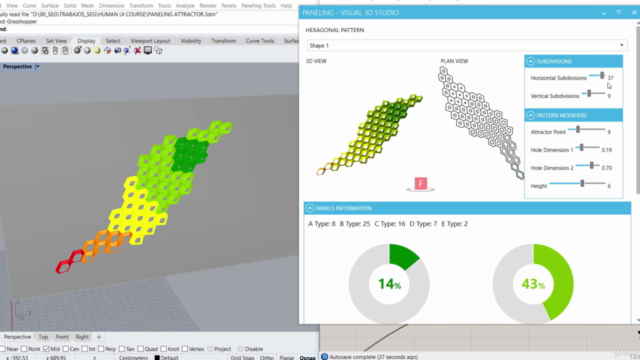
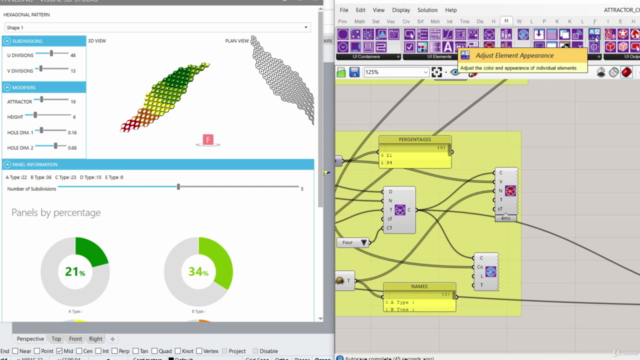
- Presenting Data Clearly: Learn to present complex information, such as the number of panels in a paneling subdivision, in a clear and accessible format. 📊
Course Outline:
- Understanding HUMAN UI: A deep dive into the plugin's interface and capabilities.
- Essential Tools & Techniques: Focus on the core tools of HUMAN UI that will revolutionize your workflow.
- Creating Custom Interfaces: Learn how to design interfaces that are both user-friendly and visually stunning.
- Visualizing Data with HUMAN UI: Effective ways to display data from your Grasshopper scripts in an engaging manner.
Prerequisites for Success:
To get the most out of this course, you should:
- Have a solid grasp of the basics to intermediate level of Grasshopper 🌱
- Understand the structure of data trees and how they function within computational design 🌳
- Possess fundamental modeling knowledge in Rhinoceros, ensuring a smooth learning experience. 🏗️
Who Should Take This Course?
This course is tailored for:
- Architects and designers who wish to enhance their computational design skillset. 👨💻👩💻
- Engineers eager to integrate interactive data visualization into their workflow. ⚙️
- Computational design enthusiasts looking to push the boundaries of data representation. 🚀
By the end of this course, you will not only be proficient in using HUMAN UI within Rhino and Grasshopper but also capable of creating compelling interactive interfaces that bring your visualization projects to life. Join us on this exciting journey into the future of data representation! 🎓💫
Course Gallery


Loading charts...