Dynamic Dashboards and Data Analysis with Looker Studio

Why take this course?
🎓 Unlock the Secrets of Data with Dynamic Dashboards and Data Analysis with Data Studio 2022!
Course Overview:
Embark on a journey to master Dynamic Dashboards and Data Analysis with Google Data Studio, the platform that turns complex data into compelling stories. This course is meticulously crafted for data analysts, marketers, and business enthusiasts looking to unlock the power of their data, enhance decision-making processes, and drive results with ease.
What You'll Learn:
Introduction to Key Concepts:
- Aggregation, Pivot Tables, Calculated Fields, Data Blending, and more.
Real-World Projects:
- Project 1: Create a User Journey Funnel with Google Analytics.
- Project 2: Build a Device Breakdown Visualization with User-Level Data.
- Dashboard Building Challenge: Bring your skills to life by creating a dashboard in just 10 minutes! Receive instant feedback from the instructor and peers. ⏱️
By the End of the Course, You Will:
- Understand All Chart Types: Gain proficiency in using various chart types like Bullets, Pie Charts, Scorecards, Scatter plots, and more.
- Connect Data Sources: Proficiently connect and blend data from Google Analytics and Google Sheets.
- Create Custom Dimensions: Learn to create custom dimensions with conditional expressions using CASE + REGEXP_MATCH + IN.
- Visualize Data: Build user journey funnels, device breakdown visualizations, and more, based on real-world data scenarios.
- Work with Google BigQuery: Understand how to create tables in BigQuery and visualize your data in Data Studio.
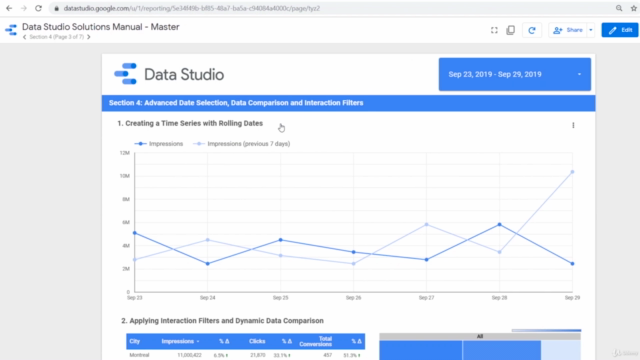
- Time Series & Filters: Learn to configure Gauge charts, automate reports with advanced date selection filters, and manage access levels (Owner vs Viewer).
- Conditional Formatting: Apply conditional formatting rules to highlight important data anomalies.
- Design Theme Application: Extract a report theme and color scheme from an image in Data Studio for a professional look.
- Advanced CASE Statements: Use IF statements within CASE and understand the importance of operators.
Student Feedback:
Hear what past students have to say about this transformative course! 🌟
- "The pace was great, and I was able to follow along with all the exercises using the provided data files and Google Analytics demo account." - Tricia
- "This course is fantastic. The instructor was clear and on-point, taking me from a complete beginner to someone who can actually build dashboards and understand how DS works." - Roi
- "The course was done with clarity and provided insightful guidance." - Silvia
Instructor Profile:
Lachezar Arabadzhiev, your guide on this data-driven adventure, is a seasoned digital markitech with over 4 years of experience specializing in performance analytics and data visualization. He has worked with industry giants like Air Canada, RBC, Kimberly-Clark, Mazda, and HSBC, and has been proficient with Data Studio and BigQuery since 2017. As a certified GMP expert and an official speaker at the Canadian Google Data & Analytics Summit in 2018, Lachezar brings a wealth of knowledge to your learning experience.
Bonus Resources:
Enroll in the course to receive:
- Custom Google Sheets data sets for each section.
- A Data Studio Solutions Manual.
- A FREE Dashboard Template upon completing the course!
Plus, we're confident that this course will exceed your expectations, offering a 30-day money-back guarantee if it doesn't meet your needs. 🛡️
Don't miss out on this opportunity to become a data analytics pro with Dynamic Dashboards and Data Analysis with Google Data Studio! 🚀 Enroll now and transform the way you approach data in your business or career.
Course Gallery


Loading charts...