Statistics/Data Analysis with SPSS: Descriptive Statistics
Why take this course?
📊 Statistics/Data Analysis with SPSS: Descriptive Statistics 🚀
Unlock Your Potential in Data Analytics!
🚀 November, 2019. Get ready to embark on a journey through the world of data analytics with a special focus on descriptive statistics – an indispensable tool for anyone looking to understand and make sense of data trends, driving informed business decisions.
🔥 Why Enroll in Our Descriptive Data Analytics Course?
With over 2000 students already reaping the benefits, this course is your gateway to acquiring marketable skills that are highly sought after by employers across various industries. By mastering descriptive statistics and IBM SPSS, you'll be equipped to perform data analyses and make data-driven decisions that can significantly impact your work's success and enhance profitability.
🔍 For Students & Professionals Alike!
Whether you're a student or a professional in any field, this beginner-friendly course will guide you through the basics of descriptive statistics and provide easy-to-understand, step-by-step instructions on utilizing IBM SPSS for effective data analysis.
✅ Course Highlights:
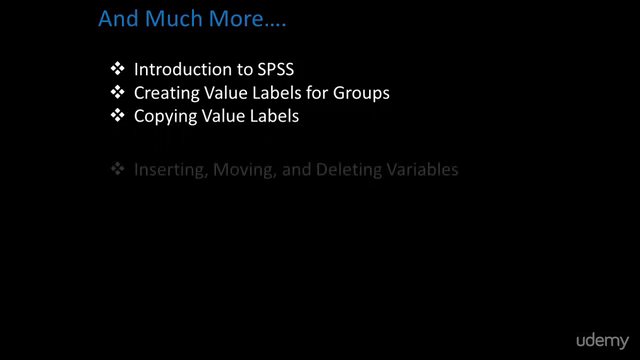
- Create, Copy, and Apply Value Labels
- Insert, Move, Modify, Sort, and Delete Variables
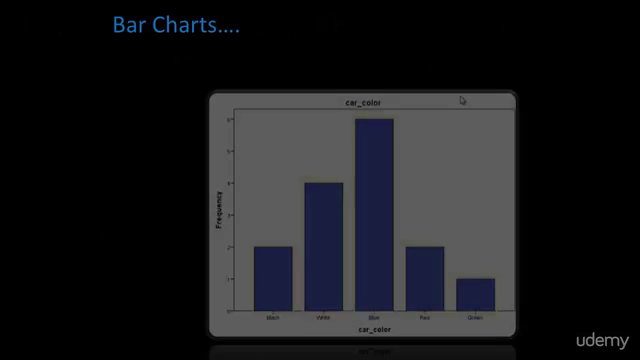
- Generate Charts and Graphs
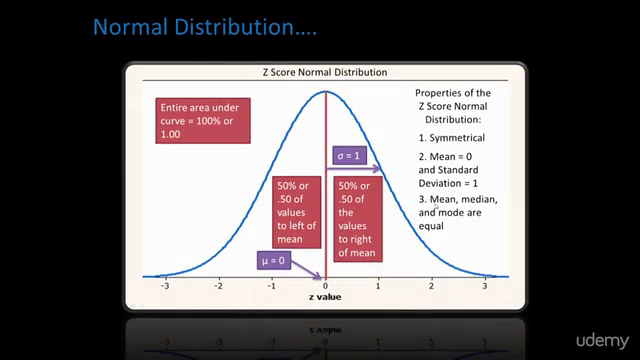
- Measure Central Tendency, Variability, z-Scores, Normal Distribution, and Correlation
📈 Interpret and Use Data with Confidence Using IBM SPSS!
IBM SPSS is a comprehensive data analysis tool that supports every step of the analytical process. From planning and data collection to reporting and deployment, this course will show you how to leverage SPSS for making valid predictions and informed decisions to drive organizational success.
📚 Course Contents and Overview:
- Introduction to IBM SPSS: Learn the basics and get comfortable with the software quickly.
- Data Manipulation: Master creating value labels, manipulating variables, and modifying default options.
- Visual Data Representation: Create clear and informative charts and graphs such as histograms and stem and leaf plots.
- Central Tendency and Variability: Understand how to calculate mean, median, mode, standard deviation, variance, and z-scores.
- Introductory Statistics Video Lectures: Dive deeper into understanding graphs, central tendency, normal distribution, variability, and z-scores with expert guidance.
🚀 Your Learning Outcomes:
Upon completing this course, you'll be well-equipped to apply your newfound knowledge of descriptive statistics and IBM SPSS to excel in your statistics classes and make smarter business decisions. You'll be able to utilize the features in SPSS to gather data effectively, interpret it accurately, and plan strategies that maximize results and profit margins.
🎓 Join Us Now!
Take the first step towards becoming a descriptive statistics expert and a data analytics pro with IBM SPSS. Enroll today and start your journey to making data work for you and your organization! 💫
Course Gallery
Loading charts...