DAX / Power BI - Data Analysis Techniques Part 1

Why take this course?
📘 Course Title: DAX / Power BI - Data Analysis Techniques Part 1
🎯 Headline: Master 10+ Data Analysis Techniques with DAX & Power BI in Part 1 of This Course!
👩💻 Course Description:
Are you a data enthusiast or a DAX and Power BI developer looking to sharpen your analytical skills? Whether you're preparing for the DA-100 exam or simply passionately delve into the world of data, this course is tailored just for you! 🚀
As a data geek, you know that the power of data lies in its analysis. In this comprehensive course, we explore the depths of Power BI and DAX through 10+ different data analysis techniques that will elevate your data storytelling and predictive analytics capabilities.
What You'll Learn:
-
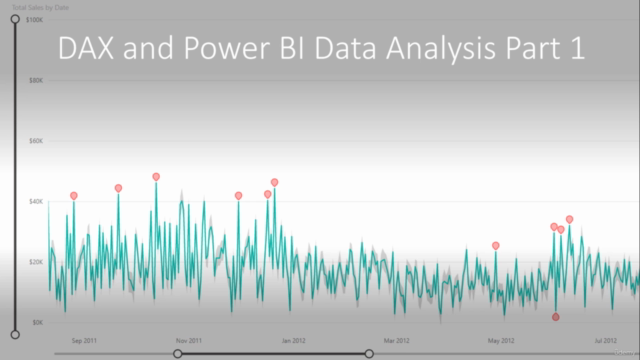
🎯 AI-Driven Techniques: Dive into advanced AI features such as Anomaly Detection, Key Influencer Analysis, Q&A Analysis, and Decomposition Tree analysis to uncover hidden patterns within your data.
-
⏱ Time Series & Forecasting: Gain insights into predicting future trends with robust time series analysis techniques.
-
📖 Smart Narrative & Geospatial Analysis: Learn how to create compelling narratives from your data and visualize geospatial trends to bring your data to life.
-
🧐 Quick Insight Analysis: Quickly generate insights with minimal data modeling, perfect for those on-the-fly analysis needs.
-
📊 Grouping & Binning Techniques: Master the art of categorizing and analyzing your data to uncover group-specific trends and patterns.
-
💰 Currency Conversion Analysis: Understand the impact of currency fluctuations on your business with this essential analysis tool.
And that's just the beginning!
As we wrap up Part 1, you'll be well-equipped to tackle a variety of complex data scenarios. But the learning journey doesn't end here - stay tuned for Part 2, where we delve even deeper:
-
📐 Cluster & Cohort Analysis: Segment your data to find patterns within subgroups.
-
🛠️ Integration with R & Python: Combine the analytical prowess of DAX and Power BI with R and Python for advanced data manipulation.
-
📈 Pareto Principal Analysis: Identify the 20% of factors that contribute to 80% of your results, optimizing business performance.
-
⏱️ Customer Attrition Analysis: Predict and analyze customer churn to proactively retain valuable customers.
-
🛒 Basket Analysis: Understand purchase behaviors and cross-sell opportunities by analyzing the items that customers buy together.
-
📉 Variance Analysis: Identify and explain deviations between budgeted financial figures and actual performance.
-
🚀 Ranking Analysis: Prioritize data points to focus on the most critical factors first.
Hands-On Practice:
Each technique we cover will be reinforced with practical exercises, allowing you to apply what you've learned directly to real-world scenarios. This course is designed not just to educate but to empower you with hands-on experience that will serve you well in your career and towards your DA-100 exam preparation.
Ready to transform your data analysis skills? Enroll now and become a Power BI and DAX wizard! 🧙♂️✨
Enroll Today & Elevate Your Data Analysis Game with Randy Mindercourse: DAX / Power BI - Data Analysis Techniques Part 1!
Course Gallery


Loading charts...