Coding to analyze and visualize data: a class of examples

Why take this course?
🚀 Coding to Analyze and Visualize Data: A Class of Examples 📊🎉
Unlock the World of Data with Python!
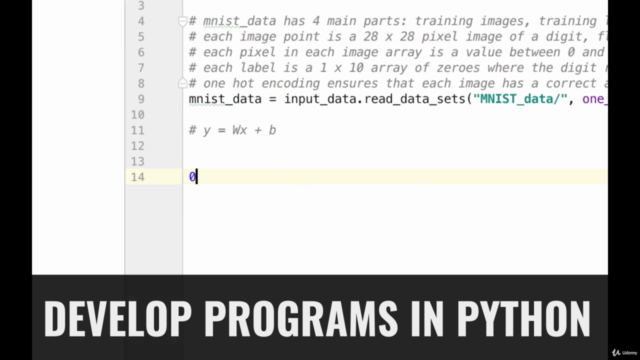
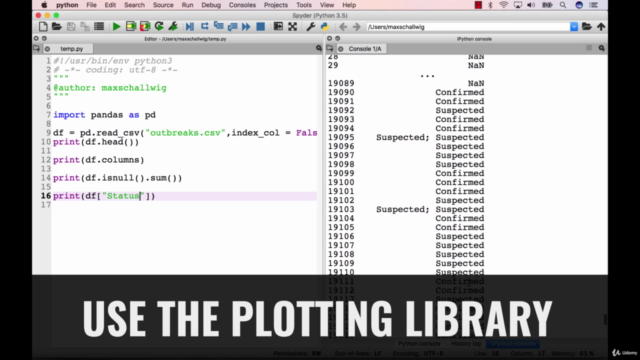
Are you ready to embark on a journey into the fascinating world of data analysis and visualization? 🌐 Whether you're a complete beginner or just looking to expand your coding skillset, Mammoth Interactive's "Coding to Analyze and Visualize Data: A Class of Examples" course is your perfect starting point! With no prior programming experience required, this course is designed to guide you through the wonders of Python, pandas, and Matplotlib. 🐍📈
Why Join This Course?
- Tailored for Everyone: This course is accessible to all, regardless of your current skill level. Our friendly, expert instructors will take you by the hand and lead you through every step of the learning process.
- Real-World Applications: From visualizing financial data to creating dynamic graphs for games, the skills you learn will be directly applicable to a wide range of projects.
- Engaging & Practical: We believe in learning by doing. This course is packed with hands-on projects that make learning Python for data analysis and visualization not just educational but also genuinely fun! 🎮📚
- Equipped with Essential Tools: You'll get comfortable with Python 3.5, pandas, Matplotlib 1.5, and more, giving you a solid foundation to build upon.
What Will You Learn?
- Data Visualization Techniques: Master the art of creating beautiful visualizations with histograms, pie charts, box and whisker plots, and more.
- Python Proficiency: Code confidently in Python, understanding its syntax and structure.
- Data Manipulation with pandas: Learn to create, manipulate, and analyze dataframes, which are essential for data analysis.
- Data I/O with CSV: Read and write data effortlessly from and to CSV files.
- Statistical Analysis: Discover how to approach data analytically by analyzing it, locating relevant data, making statistical descriptions, and plotting your findings.
- Matplotlib Mastery: Create stunning line and scatter plots, customize graphs with text, labels, a legend, and delve into figures and subplots.
- Finance Data Integration: Fetch finance data from Yahoo to make your analysis more real and impactful.
- Graph Customization & Understanding: Personalize your visualizations with aesthetically pleasing elements and understand the mechanics of figures and subplots.
- Basic 3D Plotting: Explore the world beyond 2D plots with basic 3D plotting techniques.
This course was funded by a wildly successful Kickstarter! Its popularity speaks volumes about its quality and effectiveness in teaching data analysis and visualization through Python.
Who is this course for?
- Aspiring data analysts or visualizers
- Entrepreneurs who want to leverage data in their business ventures
- Educators looking to teach data science concepts
- Gamers interested in integrating data analysis into their game development
- Anyone curious about the power of Python and its libraries for data manipulation and visualization!
Take the next step towards becoming a data guru today! Enroll in "Coding to Analyze and Visualize Data: A Class of Examples" and join a community of learners who are as passionate about data as you are. 💻🚀
Don't miss out on this opportunity to transform your coding skills and unlock the secrets of data analysis and visualization with Python! Sign up now and start your journey towards becoming a data expert!
Course Gallery


Loading charts...