Data Visualization with Python and Power BI

Why take this course?
🌐 Master Data Visualization with Python and Power BI: A Comprehensive Course by Harshit Srivastav
🚀 Course Title: Data Visualization with Python and Power BI
📚 Headline: Unlock the Power of Data Insights with Python Matplotlib & Seaborn, and Elevate Your Reports in Power BI!
Dive into the world of data visualization with our expert-led course that merges the versatility of Python with the robustness of Power BI. This isn't just a course; it's a journey into transforming raw data into compelling narratives through interactive and insightful visualizations.
Why Python? 🐍
- Advanced & Versatile: Python stands out in fields like machine learning and data science due to its concise and readable syntax.
- Efficiency: Python allows you to achieve complex tasks with fewer lines of code, making your work more efficient and maintainable.
Discover Power BI's Potential:
- Interactive & Intuitive: Power BI simplifies the process of data cleaning, modeling, and visualization, turning complexity into simplicity.
- Business Intelligence: Leverage Power BI for a wide range of applications including data science, machine learning, ERP, and data analysis.
Course Overview: This course is designed to elevate your data visualization skills using Python's powerful libraries like Matplotlib and Seaborn, and then integrate those insights into Power BI. You'll learn to create advanced visualizations that reveal deeper data insights compared to the default options in Power Bi.
What You Will Learn:
-
Python Visualization with Matplotlib & Seaborn:
- Install Python packages and define your data paths.
- Create a Line chart to track trends over time.
- Design a dashed scatterplot for more detailed analysis.
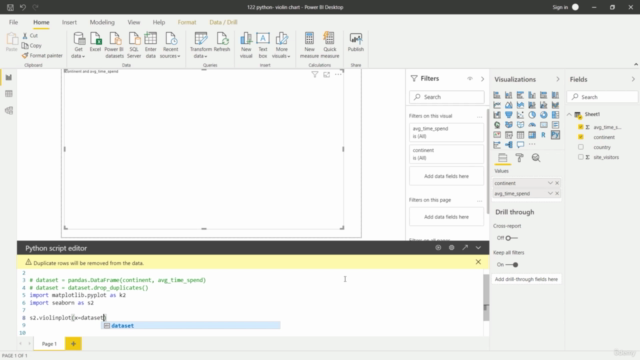
- Explore Violin charts to visualize distribution and outlier detection with ease.
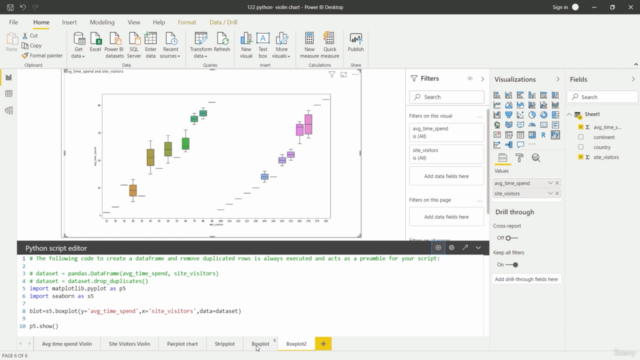
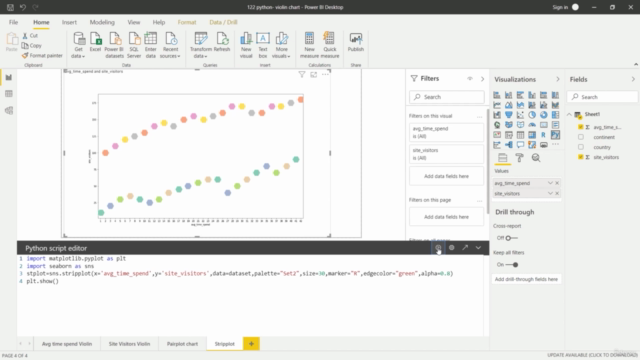
- Learn about Stripplots, Boxplots, and Lmplot/Align plots for in-depth data exploration.
-
Advanced Power BI Visualizations:
- Craft Ribbon Charts for clear quantitative comparisons.
- Analyze data with Table and Matrix visualizations, including Drill Down capabilities.
- Create Donut Ring charts to highlight key figures in a visually engaging format.
- Utilize Simple Maps and slicers for geographic data representation.
- Master the use of Date Slicers for dynamic time-based data analysis.
Practical Skills for Real-World Applications:
- Install necessary Python packages.
- Understand and apply Python's powerful libraries for data visualization.
- Create advanced Power BI reports with custom Python charts.
- Filter and interpret your data with Slicers and Maps within Power BI.
Join Harshit Srivastav on this enlightening journey to become a data visualization expert, blending the analytical power of Python with the dynamic capabilities of Power BI. 📈✨
Enroll now to transform your data into meaningful stories and gain a competitive edge in the field of data science and business intelligence!
Course Gallery


Loading charts...