Data Visualization with Python and Matplotlib
Why take this course?
📊 Master Data Visualization with Python and Matplotlib
Headline: Unlock the Secrets of Big Data with Python's Powerful Visualization Tools!
Course Overview
In today's data-driven world, the ability to visualize complex datasets is invaluable. Whether you're a data analyst, researcher, or someone looking to enhance your analytical skills, this course will equip you with the knowledge to transform raw data into compelling and insightful visualizations using Python 3 and Matplotlib.
What You Will Learn
-
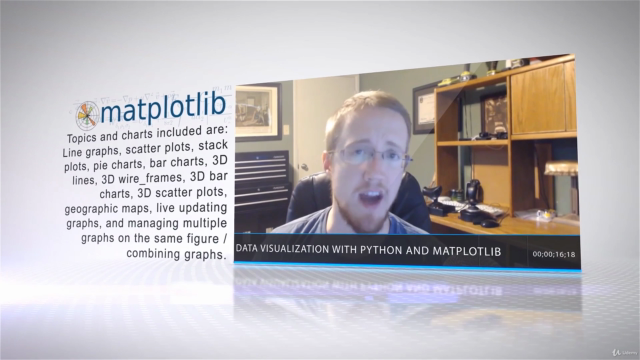
Data Visualization Fundamentals: Dive into the world of Python and understand how it can be used to visualize various forms of 2D and 3D graphs, including line graphs, scatter plots, bar charts, and more.
-
Advanced Data Handling: Learn to load and organize data from different sources seamlessly for your visualization needs.
-
Interactive Graphs: Create live updating graphs that bring your data to life.
-
Customization Techniques: Add finesse and style to your graphs, making them not only informative but also visually appealing.
Python Data Visualization: A Comprehensive Approach
This course is packed with over 58 lectures and 6 hours of content, ensuring you cover nearly every type of chart Matplotlib can generate. Suited for Python users with a basic understanding, this course takes you on a journey from the basics to advanced visualization techniques.
Course Breakdown
-
Starting Simple: Learn about labels, titles, window buttons, and legends, which are the building blocks of any graph.
-
Popular Graph Types: Master line graphs, scatter plots, stack plots, pie charts, bar charts, and more, with practical examples and exercises.
-
Advanced Features: Discover how to import data from CSV or NumPy sources and manipulate your visualizations with customized spines, styles, annotations, averages, and indicators.
-
Geographical Plotting: Explore the Basemap module for geographically inspired plots.
-
3D Visualization: Dive into advanced wireframes and other 3D charting options available in Matplotlib.
Why Choose This Course?
By completing this course, you will:
-
Gain a deep understanding of data visualization options in Python.
-
Learn to create well-presented, visually appealing graphs.
-
Acquire the skills to convey complex information with clarity and impact.
Tools at Your Disposal
-
Python 3: A programming language that's both accessible for beginners and powerful enough for experts. It's a stepping stone to mastering advanced coding languages and is highly versatile in its applications.
-
Matplotlib: An indispensable library for Python that provides the tools you need to turn data into professional-looking graphs.
-
IDLE: The recommended Integrated Development Environment (IDE) for this course, where you'll bring your visualizations to life. While you can use any IDE, IDLE is user-friendly and perfectly suited for beginners starting with Matplotlib.
Embark on your journey to become a data visualization expert today! With Python and Matplotlib, you're not just learning to see the data; you're learning to tell its story. 📊✨
Course Gallery
Loading charts...