Data Visualization with D3.js: Step-By-Step Tutorial

Why take this course?
🌐 Data Visualization with D3.js: Step-By-Step Tutorial
Headline: 🚀 Master Interactive Data Visualization with D3.js V4!
Course Description:
Welcome to an engaging journey into the world of data visualization with D3.js, where you'll learn to transform raw data into captivating illustrations that tell compelling stories. This comprehensive course is tailored for anyone looking to master interactive data visualization using one of the most powerful JavaScript libraries available today - D3.js (Data-Driven Documents).
🚀 What You Will Learn:
- Setup & Basics: Get started by setting up your D3.js development environment and understanding the basic patterns for visualizing data.
- Interactive Visualizations: Animate data transitions, create charts, and learn to interact with your data in ways that captivate users.
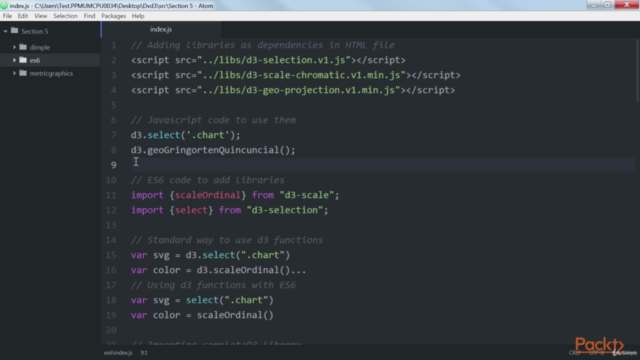
- Real-World Techniques: Work with selections, integrate external resources (static and streaming), visualize geospatial data, and utilize D3.js scales and colors effectively.
- Advanced Projects: Build five unique data visualization projects from scratch, ranging from simple charts to complex business applications with real-time interactivity and export options.
📚 Course Structure:
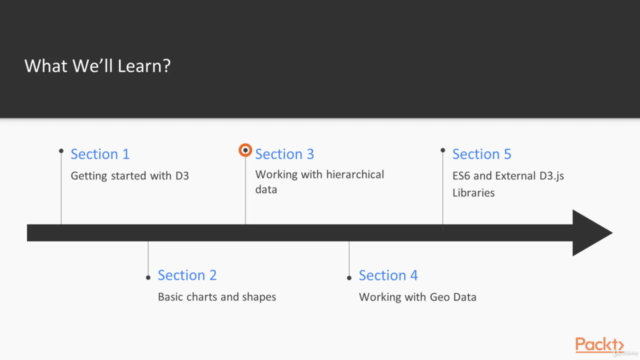
This course is divided into three complete courses for a comprehensive learning experience:
-
Creating Data Visualization with D3 🎨
- Set up your D3.js environment and visualize your data with practical examples.
- Learn techniques for creating custom graphs and visualizations.
- Transform raw data into beautiful visualizations step by step.
-
Applied Data Visualization with D3 📊
- Enhance your skills with more complex processes like data transitions, charts, and map visualizations.
- Integrate external resources and add custom shapes and paths to your visualizations.
- Work with real-time data streams and apply advanced D3.js API functionalities.
-
D3.js Data Visualization Projects 🌟
- Implement features in two complete applications from scratch, including a complex business application.
- Create scalable data-intensive apps for the big data domain.
- Export your interactive real-time visualizations with various options.
🌍 By the end of this course, you will have developed a strong foundation in D3.js, enabling you to create stunning visualizations that captivate and communicate complex datasets effortlessly.
👩🏫 Meet Your Expert(s):
Our expert authors Jos Dirksen & Michael Heydt bring a wealth of knowledge and experience to your learning journey:
-
Jos Dirksen is a seasoned software developer and architect with over a decade of experience. His expertise spans backend technologies like Java and Scala to frontend development using HTML5, CSS, and JavaScript. Jos is also a conference speaker and an active blogger who enjoys experimenting with new technologies, particularly in the realm of data visualization.
-
Michael Heydt is an independent consultant, programmer, educator, and trainer with a passion for learning and sharing his knowledge of cutting-edge technologies. With over ten years of experience across various industries, including media, finance, energy, and healthcare, Michael has a deep understanding of web, cloud, and mobile technologies and user experience design.
📈 Join us on this data visualization adventure with D3.js and unlock your potential to turn numbers into narratives! 📈
Course Gallery


Loading charts...