Data Presentation for Business: How to make great charts

Why take this course?
🚀 Data Presentation for Business: Mastering the Art of Chart Communication 📊
Course Overview:
In our data-driven world, the ability to present data effectively is invaluable. Whether you're analyzing sales figures or interpreting market trends, knowing how to translate numbers into compelling visuals can set you apart in your career. In this comprehensive course, we'll explore the critical skills necessary to harness the power of data visualization for better business decisions and clearer communication.
What You'll Learn:
-
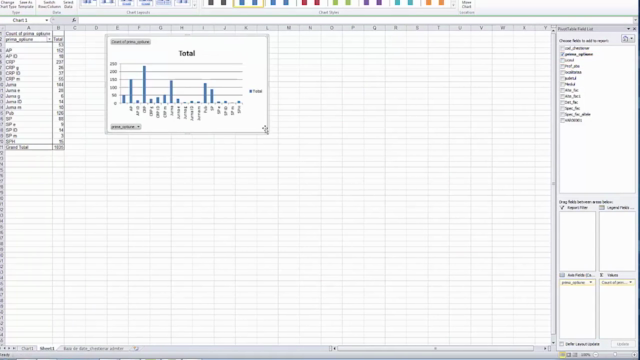
The Foundations of Data Visualization: Discover how charts and graphs are constructed and what each component represents.
-
Effective Data Presentation: Learn strategies to highlight the most important parts of your data, ensuring that your audience can't help but see what you want them to.
-
Choosing the Right Graph Type: Understand which graph or chart is most effective for different types of data sets, enhancing the clarity and impact of your message.
-
Common Pitfalls & Misconceptions: Identify and avoid the typical errors that can mislead your audience or dilute your data's story.
-
Ethical Considerations: Recognize when charts are intentionally designed to deceive, ensuring you don't fall victim to misleading information.
Why This Course? 🎓
In today's fast-paced business environment, the ability to analyze and present data visualizations is a highly sought-after skill. Regardless of your job function, understanding how to see patterns, uncover hidden trends, and convey insights through visual means can be incredibly advantageous. This course is designed for beginners with no prior experience or specialized knowledge. All terminology will be clearly explained, making it accessible to everyone.
Course Content & Overview:
Section 1: Introduction to Data Visualization
- Understanding the importance of data visualization in business.
- Basics of how charts and graphs are constructed.
Section 2: Designing Effective Charts
- Techniques to draw attention to critical data points.
- Tips on choosing the right visualization for your data.
Section 3: Analyzing Mistakes and Misrepresentation
- Identifying common chart-related errors and pitfalls.
- Learning how to interpret data correctly without being misled.
Section 4: Ethical Considerations in Data Representation
- Recognizing when charts are used to deceive or manipulate data.
- Understanding the ethical implications of data visualization.
Course Features:
- Almost 2 Hours of Expert Video Lectures: Engage with content that's easy to understand and apply.
- Supplemental Materials: Enhance your learning experience with a wealth of additional resources.
- Quizzes at the End of Each Section: Test your knowledge and reinforce what you've learned.
- Flexible Pace: Complete the course in as little as 2 hours or take your time over several days, depending on how deeply you wish to explore the content.
By the End of This Course, You Will Be Able To:
- Interpret and present complex data in a clear and understandable manner.
- Make informed decisions based on visual data analysis.
- Recognize deceptive practices in data representation and avoid falling into these traps.
- Communicate your findings effectively to stakeholders or team members.
Embark on a journey to transform your ability to analyze and present data with our "Data Presentation for Business" course. Enhance your professional skill set, make smarter business decisions, and become a more effective communicator today! 💡🌟
Course Gallery


Loading charts...