Data Visualization using R programming

Why take this course?
📊 Master Data Visualization with R: A Journey Through ggplot2 🚀 TDM Course Title: Data Visualization using R programming
🚀 Course Description:
Embark on an exhilarating journey into the realm of data visualization with our comprehensive online course, Data Visualization using R programming. This isn't just another technical tutorial; it's a transformative experience that will elevate your data storytelling to new heights. Harness the full potential of R and ggplot2, a powerful and free package within R Studio, to create visual representations of data that are both beautiful and informative.
📈 What You'll Learn:
-
The Fundamentals of Data Visualization with R: Understand the core principles and the importance of knowing your data before choosing the right type of graph.
-
Mastering ggplot2: Dive deep into this revolutionary approach to creating visualizations in R, layer by layer. Learn how its intuitive design makes complex graphics simple to achieve.
-
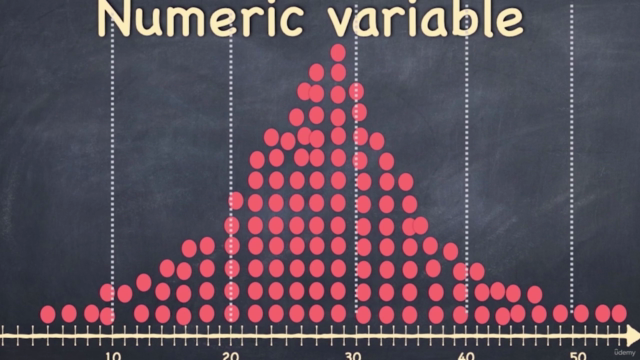
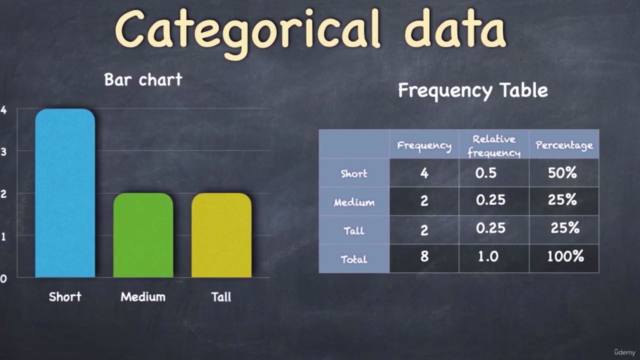
Histograms & Bar Charts: Discover when and how these static visualizations can reveal the distribution and categorical data within your dataset.
-
Scatter Plots: Explore the relationships between variables in your data with precision and clarity.
-
Line Graphs: Trace trends over time and bring your time-series data to life.
-
Advanced Techniques: As you progress, uncover the secrets behind more advanced visualizations like faceting, theming, and interactive plots.
🔍 Why ggplot2?
-
Unmatched Control: ggplot2 allows for intricate manipulation of your data visualization.
-
Elegant Syntax: Enjoy the simplicity and readability of the ggplot2 grammar of graphics.
-
Community Support: Benefit from an extensive community and a wealth of resources at your fingertips.
-
Endless Creativity: Let your imagination run wild, as ggplot2 can turn even the most abstract ideas into compelling visualizations.
🎉 Who Should Take This Course?
This course is perfect for:
-
Data Analysts and Scientists looking to enhance their data presentation skills.
-
Aspiring Data Visualization Specialists eager to learn industry-standard tools.
-
Students and Professionals who wish to expand their data analysis toolkit with R.
🎓 Instructor: Greg Martin, a seasoned expert in data visualization and an enthusiastic evangelist of R programming and ggplot2. With years of experience turning complex datasets into engaging stories, Greg will guide you through each step of the way, ensuring you not only learn but also understand the 'why' behind every technique.
📅 Enroll Today!
Don't miss out on this opportunity to revolutionize your approach to data visualization. Sign up now and start your journey towards becoming a ggplot2 master. With each lesson, you'll be one step closer to transforming your datasets into captivating narratives that inform and inspire. Let's make data visualization not just a part of your workflow, but an art form! 🎨📊
Enroll in Data Visualization using R programming today and take the first step towards becoming a data storytelling virtuoso with R and ggplot2. Your adventure into the world of data visualization awaits!
Course Gallery


Loading charts...