Microsoft Excel for Data Analytics

Why take this course?
🚀 Course Title: Microsoft Excel for Data Analytics: Master Data Visualization! 📊
Headline: Unleash the Power of Data with Excel - From Novice to Expert in Data Visualization! ✨
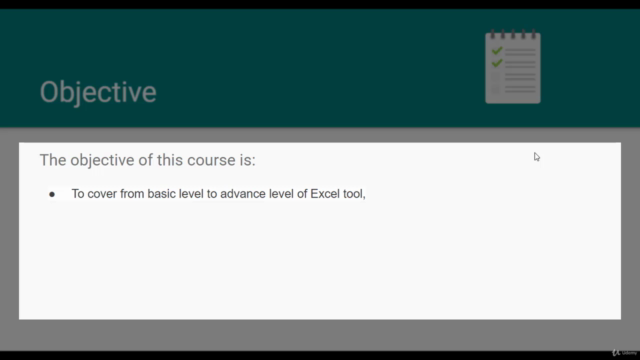
🎉 Introduction: Welcome to our comprehensive online course, "Data Visualization Using Excel"! Dive into the world of data analytics and transform yourself from a beginner to an advanced Excel user. This course is your gateway to mastering Microsoft Excel – a tool indispensable in the realm of data analysis and visualization.
📘 Course Overview: This course is meticulously designed for individuals who aspire to gain proficiency in data cleaning and data visualization using Excel, one of the most potent tools at your disposal. By the end of this journey, you will be equipped with a robust skill set that will enable you to read, clean, analyze, and visualize data with confidence.
🚀 What You Will Learn:
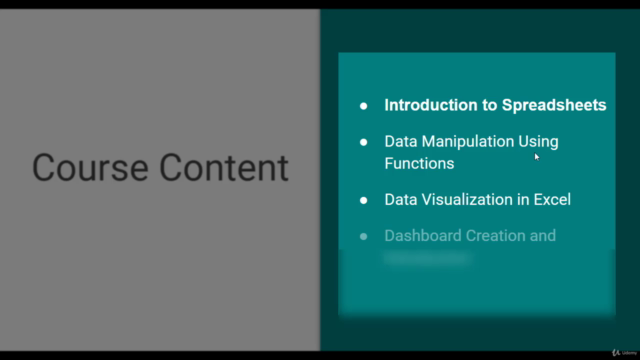
- 📈 Data Cleaning: Learn the art of transforming raw data into a refined dataset ready for analysis.
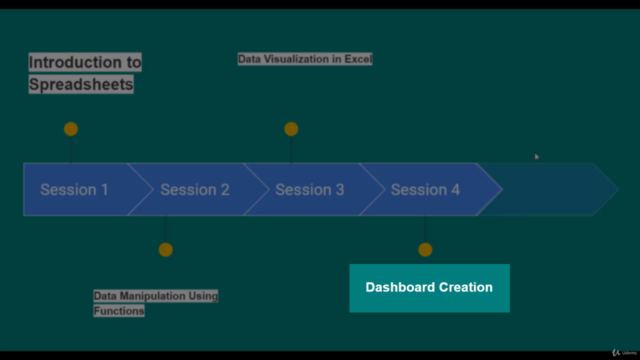
- 🛠️ Data Visualization: Master the creation of compelling dashboards and reports that bring your data to life.
- 🔧 Excel Functions: Gain expertise in all Excel functions, allowing you to manipulate and analyze data with precision.
- 📊 Dashboard Creation: Develop the skills to create multiple dashboards that offer clear and actionable insights.
- 📝 Reporting: Learn how to compile your findings into professional reports that stakeholders can easily understand.
🎓 Key Features of the Course:
- Step-by-Step Guidance: From the basics to advanced techniques, every step is covered with clarity and detail.
- Real-World Examples: Learn through practical examples that are relevant and engaging.
- Hands-On Practice: Apply what you learn with exercises that reinforce your skills.
- Expert Instructor: Learn from Tamanna, a seasoned course instructor with a passion for data analytics and a knack for teaching complex topics in an accessible way.
🌟 Why Choose This Course?
- Practical Skills: This course equips you with practical skills that are highly sought after in the job market.
- Flexible Learning: Study at your own pace, anytime and anywhere you have internet access.
- Community Support: Join a community of like-minded learners who share your passion for data analytics.
- Career Advancement: Stand out in your career by adding Excel proficiency to your resume.
📅 Enrollment Details: Take the first step towards becoming an Excel expert today! Enroll now and unlock the full potential of data visualization. With "Data Visualization Using Excel," you're not just taking a course; you're opening doors to new career opportunities and enhancing your data management capabilities. 🌟
🎉 Conclusion: Embark on this transformative learning experience and become the data analyst that companies are eager to hire. With "Data Visualization Using Excel," you're ready to tackle any data challenge that comes your way. Enroll today and let Excel do the heavy lifting for your data analysis needs! 🎓🚀
Course Gallery


Loading charts...