Learn Data Visualization Techniques with Python
Learn how to create interactive, engaging, and compelling visualizations with python.
4.30 (5 reviews)

47
students
1 hour
content
May 2025
last update
$19.99
regular price
Why take this course?
Course Title: Learn Data Visualization Techniques with Python
Course Headline: 📊 Unlock the Secrets of Interactive Data Visualization with Python!
Course Description:
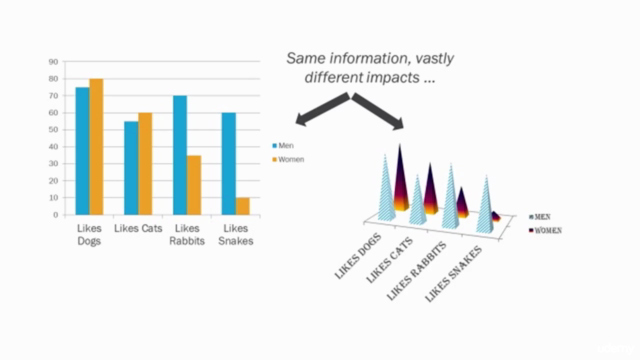
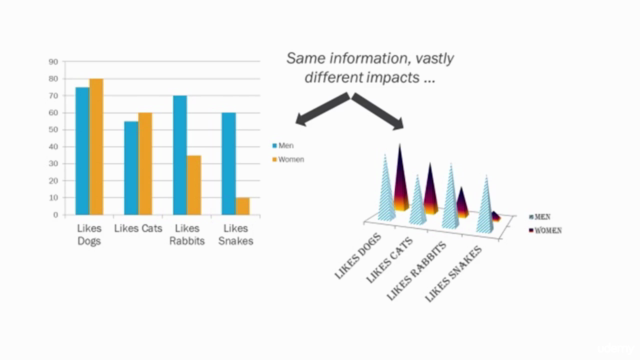
- 📈 The Fundamentals of Data Visualization: Understand the principles behind effective data visualization.
- 🚀 Python for Data Visualization: Set up your Python environment and tools for visualization tasks.
- 🎨 Chart Types Mastery: Learn to choose and apply the most appropriate chart types for different datasets and scenarios.
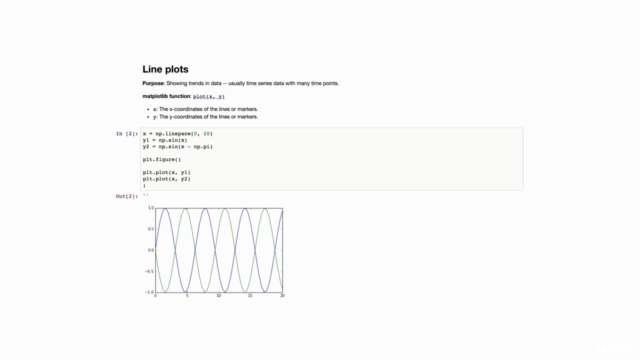
- 🛠️ Matplotlib Deep Dive: Become proficient in using matplotlib to create static, interactive, and animated plots.
- 🎯 Jupyter Notebook Integration: Combine visualizations with code and analysis in Jupyter Notebooks.
- ✨ Matplotlib Styles: Utilize a variety of styles to enhance the aesthetic appeal of your visualizations.
- 🔍 Subplots and Small Multiples: Learn how to present multiple viewpoints within a single plot for comprehensive insights.
- 📊 3D Visualization with Py3D: Dive into the world of three-dimensional data visualization using Py3D.
- 🔥 Animation Techniques: Discover how to create animations that bring your data to life.
Why Take This Course?
- Real-World Skills: Develop practical skills applicable to various industries.
- Interactive Learning: Engage with interactive content and real datasets.
- Hands-On Experience: Apply what you learn through a series of hands-on projects.
- Expert Guidance: Benefit from the expertise of seasoned professionals in data visualization.
- Flexible Learning: Access course materials at your own pace, anytime, and anywhere.
Conclusion:
Upon completing this transformative course, you will have unraveled the secrets behind crafting compelling data visualizations that captivate audiences and inspire meaningful insights. Don't miss this opportunity to become a skilled data visualization maestro—enroll now and embark on a remarkable journey towards data mastery! 🚀
Enroll Today and Transform Your Data into Stories! 📊✨ #DataVisualization #Python #SkillboxLearning #InteractiveData #DataStories #MasterDataVisuals
Course Gallery


Loading charts...
915634
udemy ID
26/07/2016
course created date
12/07/2020
course indexed date
Bot
course submited by