Data Visualization & Storytelling: The Best All-in-One Guide
Why take this course?
🌟 Data Visualization & Storytelling: The Best All-in-One Guide 🌟
Welcome to Your Data Journey!
Unlock the Power of Data with Excel
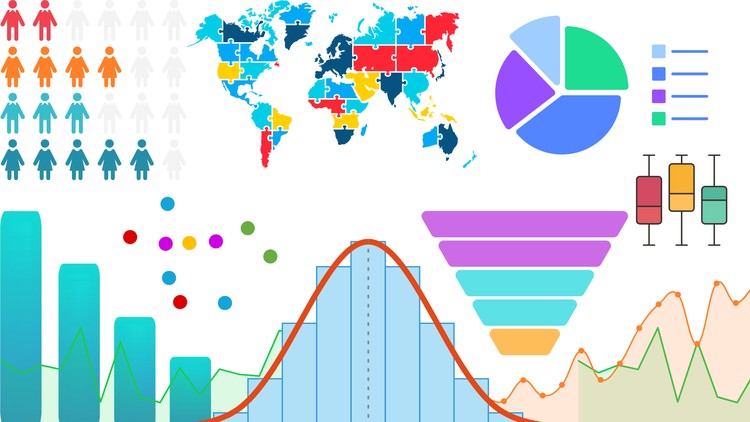
Data visualization is not just a skill—it's an art that turns complex data sets into clear, engaging stories. At Datariel Academy, we're excited to introduce you to "Data Visualization & Storytelling: The Best All-in-One Guide". This comprehensive course is meticulously crafted to help you master the art of creating impactful data visualizations with Excel—a tool that's as accessible as it is powerful.
Why Master Data Visualization & Storytelling? 🤔📊
In today's data-centric world, the ability to distill hard facts into concise, informative visual narratives is invaluable. This course will elevate your professional and personal storytelling capabilities by teaching you how to:
-
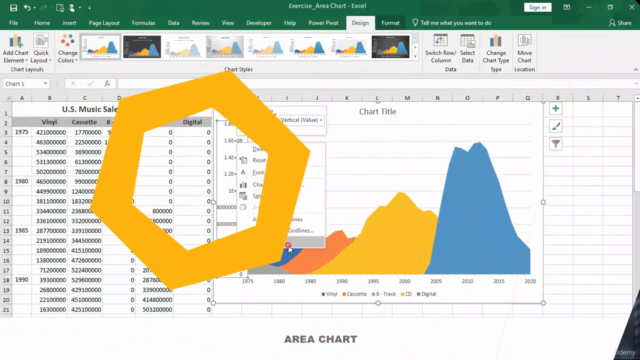
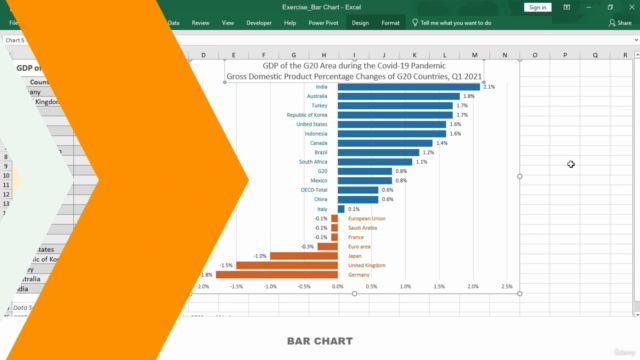
Effectively Present Data: Unleash the full potential of charts and graphs such as column, bar, pie, line, waterfall, histogram, and combo charts—all within Excel, your trusted statistical companion.
-
Interactive Data Exploration: Dive into interactive charting by utilizing intuitive Excel features like dropdown lists, radio buttons, checkboxes, spin buttons, and scroll bars to engage users and make data exploration a dynamic experience.
-
Craft Compelling Narratives (Data Storytelling): Discover how to tell engaging stories with your data, emphasizing critical insights that will stick in the minds of your audience long after they've seen your presentation.
-
Improve Decision Making: By presenting data visually, you'll be equipped to inform and influence decisions with compelling visuals that simplify complexity, leading to better outcomes.
Why Choose This Course? 🎓✨
This course is designed for everyone, whether you're a novice or an advanced Excel user. We provide a supportive learning environment where:
-
No Experience Required: We cater to all skill levels, offering step-by-step guidance on every topic.
-
Create Interactive and Dynamic Visuals: Learn how to build interactive elements into your charts, allowing users to customize views to explore different scenarios with ease.
-
Master Data Storytelling: Gain the skills to transform raw data into captivating narratives that engage viewers and drive actionable insights.
-
Career-Boosting Skills: Mastery of data visualization is highly valued in various industries, enhancing your marketability and opening doors for career advancement.
-
Real-World Applications: You'll walk away with the knowledge to create professional, engaging, and insightful data visualizations suitable for any context—be it business analytics, personal projects, or academic research.
Enroll Risk-Free with Our 30-Day Money-Back Guarantee! 🛠️💫
We're confident that this course will add a powerful new dimension to your skillset, enabling you to tell data stories that resonate and inspire action. That's why we offer a 30-day money-back guarantee. If for any reason you're not satisfied with the course content or delivery, simply let us know, and we'll issue a full refund.
Take The Next Step 🚀🎯
If you're ready to harness the power of data visualization and storytelling, enroll now and join hundreds of satisfied learners who have already embarked on this transformative learning journey with Datariel Academy.
About Datariel Academy
At Datariel Academy, we're dedicated to empowering individuals with the skills needed to thrive in the data-driven world. Our expert instructors bring years of practical experience to the virtual classroom, ensuring you receive hands-on, real-world training that is both effective and engaging. With our courses, you'll gain the confidence and expertise to take your data visualization and storytelling abilities to the next level.
Enroll today and transform the way you communicate with data!
Udicine™ Society - Where learning meets innovation. Let's unlock the stories within the data together! 📈✅
Course Gallery

Loading charts...