Data Visualization & Storytelling

Why take this course?
🎉 Master Data Visualization & Storytelling 📊🎨 🚀
Unlock the Power of Your Data with Engaging Stories!
Course Headline: (Make Charts that Move Mountains)
Course Description:
Dive into the captivating world of DataViz, where the exploration, understanding, and persuasion of data come to life! This comprehensive online course is your gateway to transforming raw data into compelling stories that resonate with any audience. Drawing from the wisdom of a renowned textbook, this course has been acclaimed in academic institutions and corporations worldwide, including Halliburton TX, Agilent, Orange, and PropertyFinder.
Why This Course?
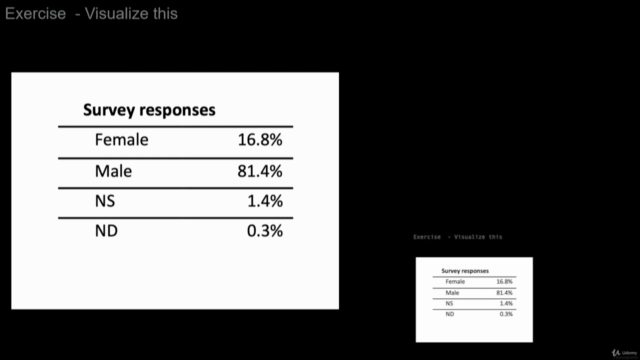
- Real-World Examples: Discover how to visualize pressing topics like gender equality, inclusion, solar energy, and bias.
- Narrative Essentials: Learn the art of integrating narrative within your graphics to elevate your data storytelling.
- Data Science & Design Thinking: Blend concepts from Data Science, Design Thinking, and Strategy for a holistic approach to visual storytelling.
- No Advanced Math Required: Whether you're an MBA candidate, instructor, strategy consultant, or entrepreneur, this course is designed for those who work with Excel, SPSS, or Tableau, with no special mathematical skills needed.
Main Outcomes:
- Understand the Role of Narrative in Charts 📈✨
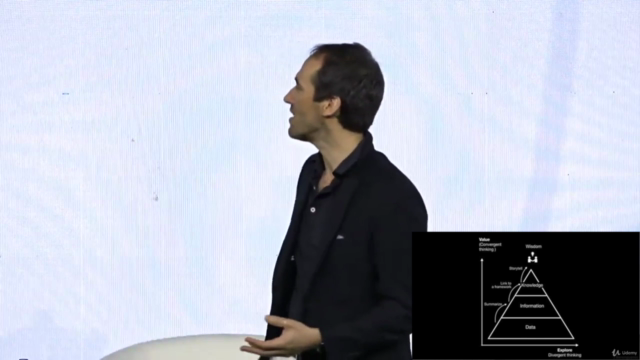
- Transform Data into Information 🔄💡
- Synthesize Knowledge Frameworks 🧠🔗
- Apply Visual Thinking Tools for Decision Making 🧩🤔
- Persuade with Visual Communication Techniques 🛠️convincing
Praise from Previous Students:
- "I was going through the book and it looks great!" – Mauricio Zanotti, Director at Ong La ruta Solar
- "Here in Argentina, the community in data science is really growing, and I love visualizations and finding ways to tell stories." – Agustin Blacker
- "An eye-opener" – Benjamin Jon, Wales
- "A holistic approach to how to create knowledge with classic rhetoric." – Birgitta Edberg
About the Authors:
Jose Berengueres: A Barcelona native and a doctor in robotics from TokyoTech, Jose has been teaching design thinking and ethics in IT at the U.A.E University since 2011. He's also a Kaggle master, mentoring startups while contributing to the field of data science.
Bibliography (Included with Course Enrollment):
- Berengueres, J. (2019). Introduction to Data Visualization & Storytelling: A Guide For The Data Scientist [English/Spanish]
- Berengueres, J. (2020). Visualización de Datos & Storytelling (B. Covarrubias, Ed.) [Español]
Reference Books (Not Included in Course Materials):
- Few, S. (2009). Now you see it
- Few, S. (2012). Show me the numbers
- Knafflic, C. N. (2015). Storytelling with Data
- Berinato, S. (2016). Good Charts (HBR)
- Duarte, N. (2019). DataStory
- Wilke, C. (2019). Fundamentals of Data Visualization: A Primer on Making Informative and Compelling Figures
- Knafflic, C. N. (2020). Storytelling with Data workbook
Ready to elevate your data storytelling skills? 🌟 Enroll in our course today and become a master of data visualization!
Course Gallery


Loading charts...