Mastering Data Visualization with R

Why take this course?
📊 Mastering Data Visualization with R: A Journey Through Base Graphics, Lattice Package, and GGPlot2
Course Headline:
Visualize data like a pro using R's powerful visualization tools—Base Graphics, Lattice, and ggplot2 (GGPlot2)—for insightful data analysis and data science.
Course Description:
This course is your gateway to transforming raw data into compelling narratives through the art of data visualization. R, a robust programming language for statistics, provides a suite of tools that enable you to create effective visualizations to represent patterns, trends, and outliers in your dataset. By mastering Base Graphics, harnessing the power of the Lattice package, and embracing the elegance of GGPlot2, you'll be well-equipped to communicate your findings with clarity and impact.
Course Highlights:
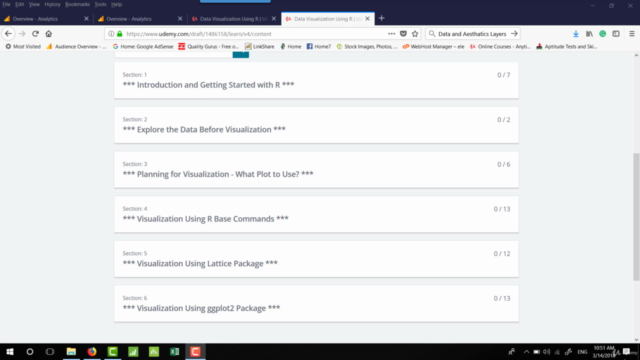
🚀 Base Graphics:
Dive into the foundational system of R for basic plotting. Learn to create:
- Single Continuous Variable plots such as Histograms, Density Plots, and Box-Whisker Plots.
- Single Discrete Variable representations like Bar Charts.
- Two Variable plots where one is continuous and the other discrete, including Pie Charts, Dot Charts, Strip Charts, and more.
- Time series visualizations with Line Charts.
📊 Lattice Package:
Discover an advanced graphics system that builds upon base graphics and introduces a multi-plot display format. This package covers:
- Histograms, Density Plots, Box-Whisker Plots, Bar Charts, Scatter Plots, Dot Charts, Strip Charts, and more.
🎨 GGPlot2 Package:
Get hands-on with the GGPlot2 package, which is based on a systematic approach to data visualization using 7 layers in ggplot(). You'll also tackle a real-world project: selecting the best diamond within a budget from a dataset of 54,000 diamonds.
Commonly Used Graphs in All Systems:
- Histogram
- Density Plot
- Box-Whisker Plot
- Bar Chart
- Scatter Plot
- Dot Chart
- Strip Chart
Student Testimonials:
🚀 "Very thorough": Roger Holeywell gave this course 5 stars, highlighting its comprehensive coverage and consistent pace. He appreciated the detailed demonstrations and the instructor's diligence in explaining the keys pressed during demos.
📈 "Clear and coherent": Martina Katalin Szabó awarded a perfect score, praising the course's structure and found it extremely useful.
🌍 Jose Maria Nogueira da Costa shared his experience: "All courses by Prof. Sandeep Kumar on Udemy are excellent, especially for analysis and visualization of data." He also rated this course with 5 stars.
Embark on your data visualization journey today and uncover the stories hidden within your data! Whether you're a beginner or looking to refine your skills, this course will provide you with the tools and knowledge necessary to excel in data analysis and visualization using R. 📊🚀
Course Gallery


Loading charts...