An Introduction to Data Visualization in R using ggplot

Why take this course?
📊 An Introduction to Data Visualization in R using ggplot 🚀
Course Headline: Unlock the secrets of data storytelling with our comprehensive online course, "An Introduction to Data Visualization in R using ggplot". Dive into the world of data representation and learn how to craft compelling plots and graphs using the powerful and versatile R programming language. 📈🍺
Course Description: Welcome to your journey into the captivating realm of data visualization! At the heart of this course lies a crucial skill for anyone dealing with data: presenting it in a way that's not only accurate but also visually appealing and understandable. With R, an open-source language that has garnered a massive following among statisticians, academics, and data scientists alike, you'll unlock the potential to turn your datasets into dynamic, insightful visual narratives.
Why Learn Data Visualization in R? 🤔
- R is Free & Open Source: Accessible for everyone, it offers a suite of tools that are both powerful and flexible for data analysis and visualization.
- Widely Used: R is the go-to language for researchers, scientists, and businesses to handle complex data tasks with ease.
- ggplot2 Library Mastery: Learn how to harness the ggplot2 package, which simplifies complex plotting structures and makes it easy to create sophisticated and aesthetically pleasing graphics.
What You Will Learn:
- 📝 Mastering ggplot in R: Understand the grammar of graphics in R, and learn how to use it effectively for your data storytelling.
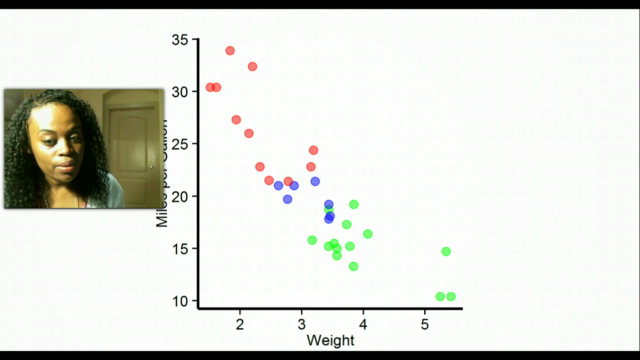
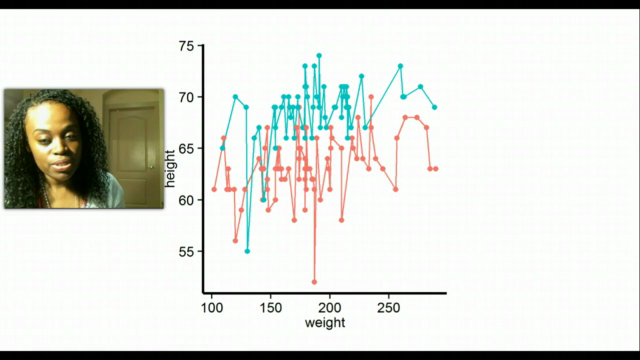
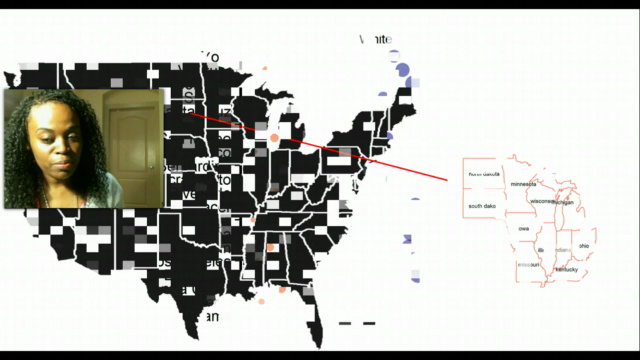
- 🎨 Creating a Variety of Plots: From Bar plots, Scatter plots, Line plots, Pie charts, to Geographical maps – you'll be equipped with the skills to present your data in its most compelling form.
- ⏰ Trend Analysis & Time Series Data: Learn to visualize trends over time, making it easier to identify patterns and forecast future events.
- 🔧 Statistical Correlations: Understand and visualize the relationships between different data points, highlighting important insights.
- 🌍 Geographical Data Visualization: Plot geographical data accurately on maps, giving context to your findings that is both specific and comprehensive.
Who Is This Course For? 👩🏫👦
- Students: Elevate your academic projects with professional visualizations.
- Professionals: Stand out in your field by presenting data clearly and compellingly.
- Entrepreneurs: Make informed decisions with better data insights and present them effectively to stakeholders.
- Data Enthusiasts: Whether you're new to R or looking to refine your skills, this course is tailored for you!
Your Instructor: Sophia Banton, a seasoned data visualization expert, will guide you through each lesson with her wealth of knowledge and practical experience in the field. She brings to the table not only technical expertise but also an eye for design that can transform your raw data into captivating stories.
Embark on Your Data Visualization Adventure Today! 🌟 Join us and become proficient in using R's ggplot2 to create plots and graphs that are not just informative but also visually stunning. Whether you're presenting to a room of experts or sharing insights on social media, your data will make an impact like never before! Sign up now and turn your data into a masterpiece with "An Introduction to Data Visualization in R using ggplot". 🎨✨
Enroll now and let your data do the talking! 📊🎉
Course Gallery


Loading charts...