Data Visualization in Python (Mplib, Seaborn, Plotly, Dash)

Why take this course?
🌟 Course Title: Data Visualization in Python (Mplib, Seaborn, Plotly, Dash)
🚀 Course Headline: Master Data Visualization in Python with the matplotlib, seaborn, plotly and dash libraries.
📊 Unlock the Secrets of Data with Python's Top Visualization Tools!
Embark on a journey to transform raw data into compelling visual narratives that can be understood by all. In this comprehensive course, you will not only learn but also master the art of data visualization using some of the most powerful and versatile libraries in Python - matplotlib, seaborn, plotly, and Dash.
Why Data Visualization?
- It's a core skill in the data scientist's toolkit, enabling you to synthesize complex datasets.
- It transforms data into understandable visual formats for decision-makers and non-technical stakeholders.
- It makes the process of extracting meaningful insights from large amounts of data more intuitive.
What You Will Learn:
-
Mastery of Visualization Libraries: Gain in-depth knowledge of Python's premier libraries for data visualization: matplotlib, seaborn, plotly, and dash.
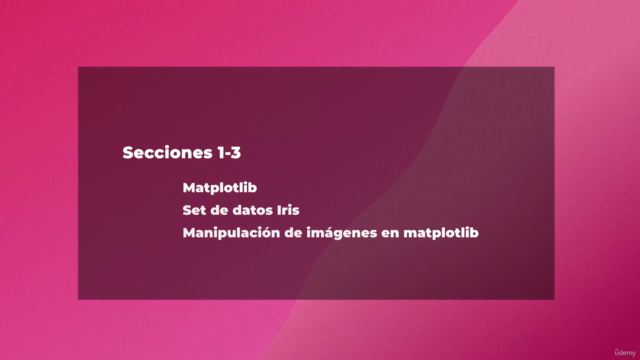
- matplotlib: Understand the basics of creating static plots and charts.
- seaborn: Learn to produce sophisticated and stylish statistical graphics.
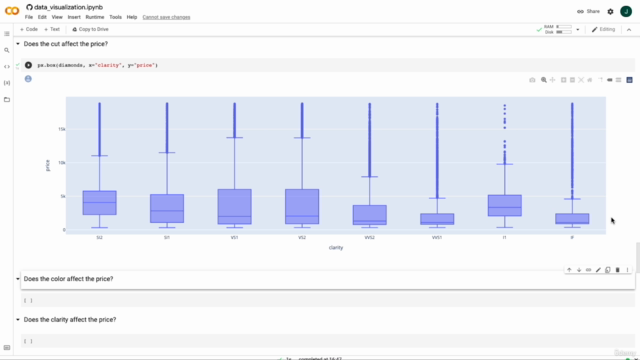
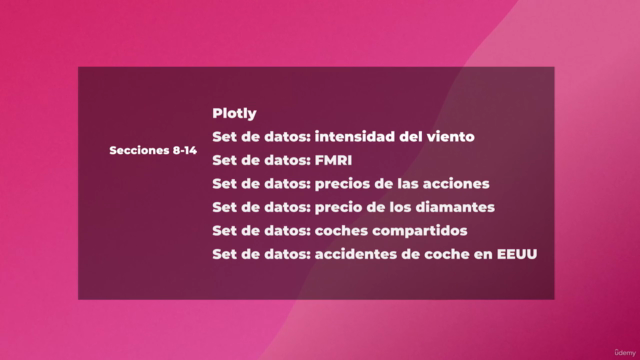
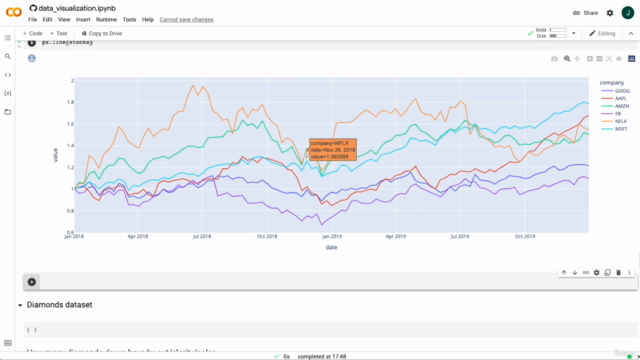
- plotly: Dive into interactive visualizations that come to life with user interaction.
- Dash: Build dynamic, web-based interfaces to display your data visualizations.
-
Extracting Knowledge from Data: Discover how to derive critical insights and trends from complex datasets.
-
Web Interface Creation: Develop interactive charts that provide real-time analytics, such as website traffic, user demographics, session durations, and sales data.
🔍 Hands-On Learning with Real Data:
Throughout this course, you will engage with 8 different datasets, each chosen to challenge and enhance your understanding of data visualization. You'll learn to:
- Interpret dataset content and construct queries to extract relevant information.
- Build a variety of graphs, from simple line and bar charts to advanced statistical graphics.
- Answer questions and reveal patterns using the tools at your disposal.
By the End of This Course:
You will be fully equipped with the skills to:
- Masterfully visualize data for a wide audience.
- Analyze datasets independently, extracting meaningful insights.
- Create compelling web interfaces that present real-time analytics.
🎓 Course Features:
- Interactive lessons and exercises with immediate feedback.
- A hands-on approach to learning, focusing on practical skills.
- Access to a supportive community of like-minded learners and mentors.
- Downloadable resources and code examples for future reference.
💡 Take the Next Step in Your Data Career:
Enroll in "Data Visualization in Python (Mplib, Seaborn, Plotly, Dash)" today and unlock your potential as a data visualizer. Whether you're a beginner or looking to sharpen your skills, this course will provide you with the expertise to present your data in the most effective way possible.
📆 Join us on this transformative learning adventure and become a pro at turning numbers into stories! 📈✨
Course Gallery


Loading charts...