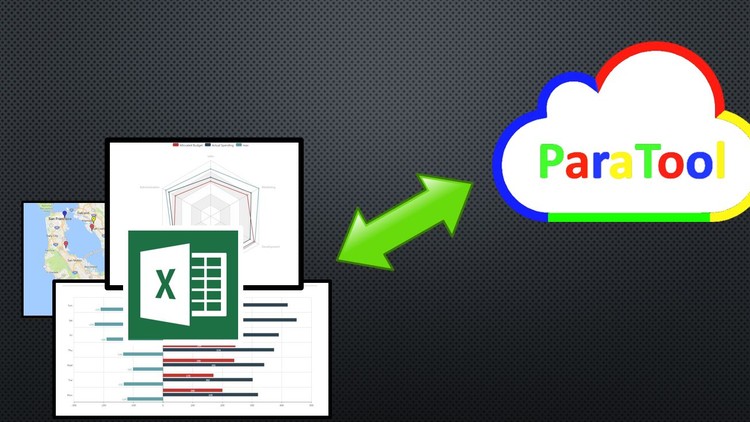
Data Visualization in Excel by Using ExTool

Why take this course?
🎉 Course Headline: Unlock the Power of Data - Master Data Visualization in Excel using ExTool!
🚀 Course Description:
Are you ready to elevate your data analysis game? If you've already got a grip on the basics of Excel, it's time to take the next step and turn your data into compelling visualizations that tell a story and reveal insights. Welcome to "Data Visualization in Excel by Using ExTool" – your ultimate guide to transforming raw numbers into beautiful, informative, and engaging visual representations!
📊 What You'll Learn:
-
Section 1: Introduction to Advanced Data Visualizations
- 3D Surface Plot: Understand the nuances of representing 3D data with clarity.
- Force Arrow Chart: Analyze directional data in a dynamic and interactive format.
- Plot Pins on a Google Map / Plot Data on a Google Map: Visualize geographical data with precision.
- Biomedical Batch Analysis Chart / Loss Analysis Chart / Scatter Plot / Multiple Stock Analysis Chart / Risk Analysis Map: Discover the interplay between data points and patterns in various sectors.
-
Section 2: Exploring Advanced Functions
- Air Quality Heat Map: Identify areas with high pollution levels intuitively.
- Candlestick Chart: Gain insights into financial trends and stock market dynamics.
- Stacked Area Line Chart: Analyze cumulative data over time with ease.
- Colored China Air Quality Chart / Multiple Funnel Chart: Present complex data in a simplified, digestible format.
- Basic Radar Chart / Bar Negative Chart: Compare multiple variables or datasets quickly.
- Sized Pie Chart / Migration Map / Sankey Diagram / Stepped Waterfall Chart / Funnel Align Chart: Each of these tools will help you understand complex data flows, distributions, and relationships.
🔍 Key Features of ExTool:
- User-Friendly Interface: No more complex coding or steep learning curves – ExTool simplifies the process for anyone familiar with Excel.
- Rich Visualization Options: Choose from a wide array of charts and maps to present your data effectively.
- Customizable Templates: Tailor your visualizations to fit your specific needs and audience.
- Interactive Capabilities: Engage your viewers with interactive charts that can be manipulated in real-time.
- Seamless Integration with Excel: Utilize the tools you're already comfortable with for enhanced data representation.
🎓 Why Take This Course?
By completing this course, you will:
- Gain a competitive edge in your career by mastering advanced Excel functions.
- Learn to present complex data in an easy-to-understand format.
- Enhance decision-making processes through visual analytics.
- Impress clients and stakeholders with professional-level data visualizations.
- Improve your data storytelling skills, making your findings more impactful.
👨🏫 Your Instructor: Zhenyu Zhu
Zhenyu Zhu is not just an instructor; he's a data visualization expert and a seasoned Excel user with years of experience in business intelligence. His teaching style is engaging, interactive, and hands-on, ensuring you get the most out of every lesson.
📅 Get Started Today!
Embark on your journey to becoming an Excel data visualization pro. Enroll now and unlock the full potential of your data with "Data Visualization in Excel using ExTool"! 🌟
Enroll Now - Take the next step in your analytics career!
Loading charts...