Data visualization and Descriptive Statistics with Python 3

Why take this course?
🚀 Master Data Visualization and Descriptive Statistics with Python! 📊📈
Course Title: Data Visualization and Descriptive Statistics with Python
Course Headline:
Dive into the world of data with our comprehensive course that equips you with the skills to visualize and analyze real-world datasets using Python 3. Learn how to craft professional charts and apply numerical descriptive statistics techniques with libraries like Pandas, scipy, and numpy. This is your chance to become a data analysis maestro!
Course Description:
Are you an analyst, a student in data science, a statistician, or a budding data scientist eager to explore the vast ocean of data? This course is tailored just for you! Analyze real-world data in a hands-on manner and learn to create compelling visualizations that tell powerful stories.
What You'll Learn:
-
📈 Advanced Python 3 Charting Techniques: Dive into the world of data visualization with libraries like seaborn, matplotlib, and pandas. Learn how to:
- Analyze global datasets on corruption perception, infant mortality rate, life expectancy, Ebola outbreaks, and more.
- Extract insights from complex datasets with ease using Python's powerful data handling tools.
-
🧫 Statistical Libraries Mastery: Gain proficiency in using numpy, scipy.stats, and pandas to compute descriptive statistics essential for real-world analysis. Understand how to handle missing values and ensure your data analysis is robust and accurate.
-
🔍 Real-World Dataset Analysis: Work with a wide array of datasets, learning how to:
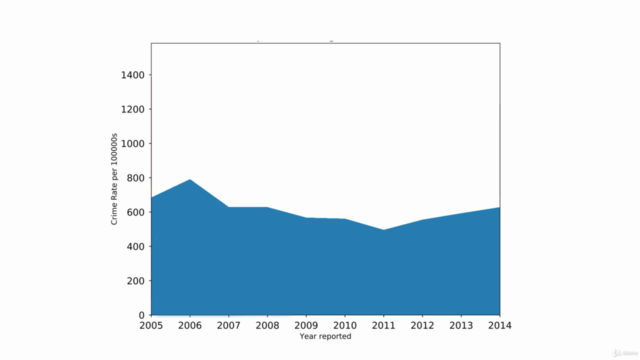
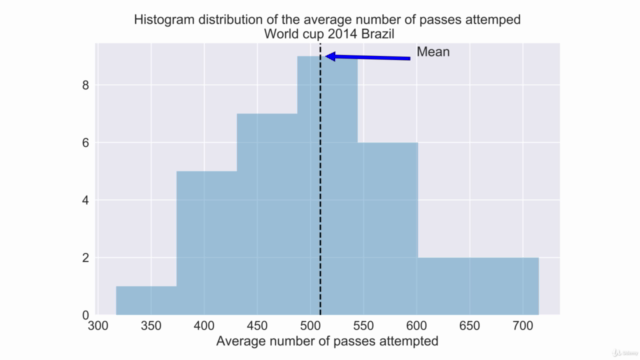
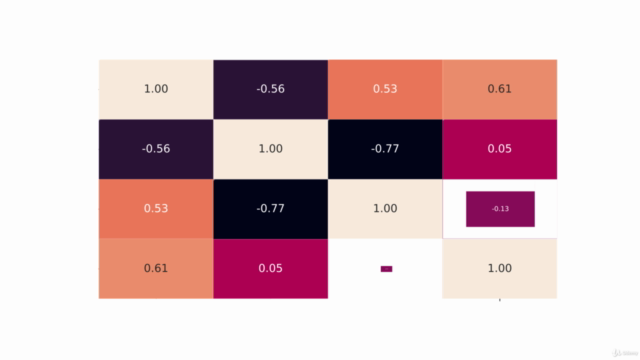
- Create correlation plots, box-plots, time series plots, comparative pie charts, areas charts, stacked bar charts, histograms, bar charts, regression plots, and more.
- Calculate correlation coefficients, determine outliers, rank data, and understand the center, spread, and relative standing of data with statistical precision.
-
🛠️ Reproducible Research with Anaconda Jupyter Notebooks: Learn to document your code using markdown within Anaconda Jupyter notebooks to achieve clear and reproducible research results. This ensures that your work is understandable and shareable among peers.
Student Testimonials:
-
"The course's practical tips in every unit have been incredibly valuable. This was a well-delivered course that provided rich resources for data visualization and descriptive statistics."
-
"As a seasoned Data Scientist with many years of experience using Python and Big Data, I found the content of this course to be an excellent resource for anyone looking to delve into data visualization in Python or to enhance their understanding of descriptive statistics. It's a comprehensive course that I would recommend to anyone entering the field."
Why Choose This Course?
- Practical Real-World Data Analysis: Learn to tackle real datasets and extract meaningful insights from them.
- Comprehensive Libraries Coverage: Master the most used Python libraries for data analysis and visualization.
- Hands-On Learning Experience: Engage with datasets that matter, from global health indicators to economic and social data.
- Professional Skills Acquisition: Elevate your data analysis skills to a professional level and make an impact with your findings.
- Reproducible Research Practices: Learn to document and share your work effectively, setting you up for success in any collaborative or research environment.
Embark on your journey to becoming a data visualization and descriptive statistics expert today! 🌟
Course Gallery


Loading charts...