Data Visualisation

Why take this course?
Course Headline: 📊 Data Visualization: Let Your Presentation Do the Talking
Course Description:
Are you ready to transform the way you present data and tell compelling stories through visualizations? Welcome to Data Visualization by ATI - Analytics Training Institute, where we delve into the art of making complex data accessible and engaging through powerful visual representations.
Why This Course?
- Engaging Content: Learn through practical examples that cover a spectrum of data types.
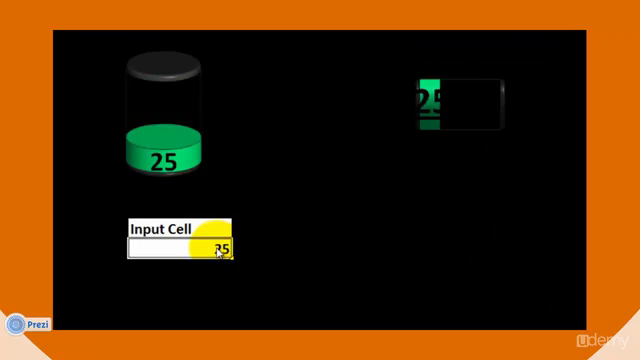
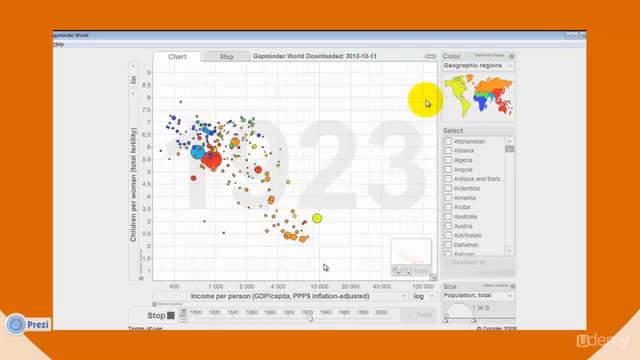
- Real-World Skills: Apply animated and moving charts to bring your presentations to life.
- Flexible Learning: Tailor your learning experience, spending 2-3 hours at a time on sections that are most relevant to you or your team.
What You'll Learn:
Key Concepts & Techniques:
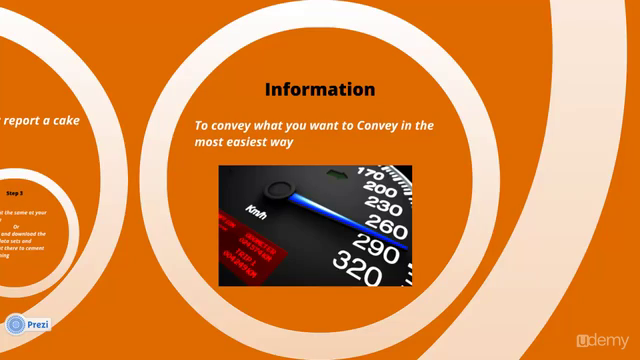
- Understanding the importance of data visualization in effectively communicating complex ideas and information.
- Exploring various types of data: categorical, numerical, time-series, geographical, and network data.
- Mastering the art of choosing the right type of visualization for your data to convey insights clearly and accurately.
Practical Examples:
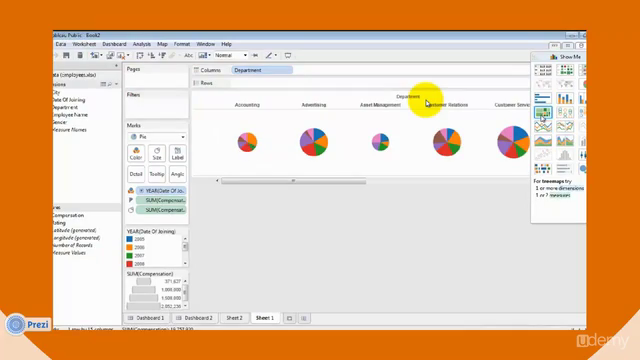
- Categorical Data: Learn to represent categorical data effectively with bar charts, pie charts, and more.
- Numerical Data: Dive into line graphs, histograms, and scatter plots to present numerical trends and distributions.
- Time-Series Data: Analyze time-series data using area charts, moving averages, and animated time lines for a dynamic presentation.
- Geographical Data: Map out geographical data with heatmaps, choropleth maps, and spatial analyses.
- Network Data: Visualize network structures with node-link diagrams and force-directed layouts to reveal patterns and relationships.
Implementation & Practice:
- Tackle one section at a time to ensure you fully understand the concepts before moving on.
- Implement your new skills in real-world scenarios for immediate application and impact at work.
- As you gain confidence, explore more complex visualizations and animations to enhance your presentations even further.
Your Learning Journey:
- Engage with Data Visualization Principles: Learn the foundational principles that govern effective data visualization.
- Interactive Examples: Work through interactive examples that demonstrate various types of data and their corresponding visualizations.
- Practice & Application: Apply what you've learned to your own datasets, turning them into compelling presentations.
- Feedback & Iteration: Share your creations with peers or mentors for feedback, refine your approach, and improve your visualization skills.
- Continuous Learning: Keep up with the latest trends in data visualization tools and techniques to stay ahead of the curve.
Who Should Take This Course?
- Data Analysts looking to enhance their presentation capabilities.
- Business Intelligence Professionals seeking to elevate their reporting and dashboard design.
- Marketing Specialists aiming to illustrate trends, patterns, and insights with greater clarity.
- Academics who wish to present research findings more effectively.
- Anyone interested in data storytelling and the effective communication of analytics.
Your Success Awaits: Embark on a journey to become a data visualization expert. With ATI's Data Visualization course, you'll learn to transform raw numbers into dynamic, informative visual stories that captivate your audience. Ready to let your presentation do the talking? Enroll today and elevate your data storytelling to new heights! 🚀
Course Gallery


Loading charts...