Data Analytics and Visualisation with Python

Why take this course?
🚀 Data Analytics and Visualisation with Python: A Udemy Exclusive Course!
👩🏫 Instructor: Christ Raharjamadiana
👀 Course Title: Master Data Analytics and Visualisation with Pandas and Matplotlib
🌍 About the Course:
🔍 Why Enroll in This Course?
- 🎓 Tailored for beginners and aspiring data enthusiasts.
- 🚀 Gain a solid introduction to the field of data analytics.
- 🧠 Learn essential statistical methods and Python programming fundamentals.
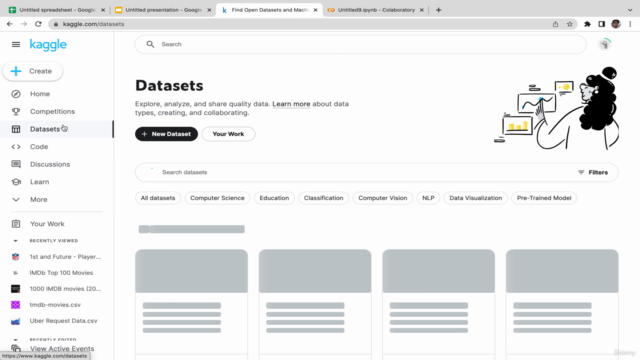
- 📊 Hands-on experience with real-world datasets from Kaggle.
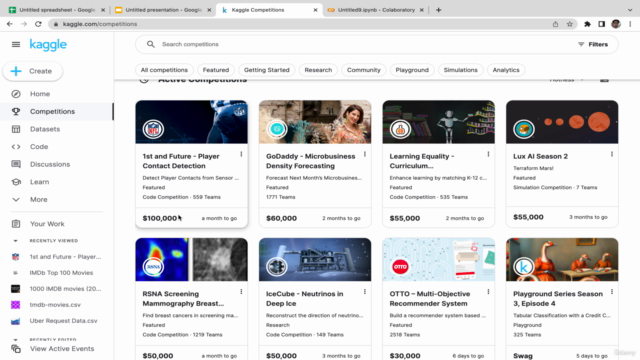
- 🏆 Engage with data competitions for practical motivation and learning.
- ✅ Build a strong foundation in data analytics, handling, and visualization.
Course Breakdown:
📚 Module 1: Introduction to Data Analytics and Python
- Understand the landscape of data analytics.
- Get started with Python for data analysis.
📊 Module 2: Data Handling with Pandas
- Master the use of Pandas for reading, preprocessing, and manipulating datasets.
- Perform statistical analyses to uncover trends and patterns.
🖨️ Module 3: Data Visualization with Matplotlib
- Explore different types of visualizations using Matplotlib.
- Create compelling data visualizations like scatter plots, bar plots, and more.
🧩 Module 4: Kaggle Data Exploration
- Access a wealth of datasets on Kaggle.
- Learn to apply your skills in real-world scenarios.
✏️ Module 5: Beginner-Friendly Approach
- No prior experience required; start from the basics and build up.
- Python and data analytics concepts explained clearly for easy understanding.
🔗 Module 6: Building Strong Foundations
- Grasp key statistical methods to support your data analysis.
- Become adept at using Pandas and Matplotlib for robust analysis.
🚫 Module 7: Data Cleaning and Preprocessing
- Learn advanced techniques to clean and preprocess data effectively.
- Handle missing values, duplicates, and outliers confidently.
🎉 What You Will Achieve:
📅 Get Started Today! Take the first step towards becoming a data analytics professional. Enroll now and transform your approach to data with Python's Pandas and Matplotlib libraries. 🌟
Sign up for "Data Analytics and Visualisation with Python" and turn data into actionable insights! 🚀📊✨
Course Gallery


Loading charts...