Complete Introduction to Google Sheets Pivot Tables

Why take this course?
🌟 Complete Introduction to Google Sheets Pivot Tables 🌟
Course Headline: Learn how to QUICKLY create POWERFUL REPORTS and DATA ANALYSIS using Pivot Tables and Graphs in Google Sheets in Seconds!
Course Description:
Are you ready to transform the way you handle data in Google Sheets? Dive into the world of Pivot Tables with our expert-led course designed to get you up and running with confidence and efficiency. 📊✨
What STUDENTS are SAYING:
- "Very well presented course on a specialized topic namely Pivot Tables in Google Sheets. Loved it." 🚀
- "The course is really great, easy to follow, with lots of practical activities. I feel very confident working with pivot tables after completing it. Thanks a lot!" 🙏
- "I found this course focussed and really useful. It covered everything you might need to know about creating pivot tables in order to analyse your data. It also teaches how to create different kind of charts from that. It doesn't cover using formulas to analyze data (without a pivot table) which was something I didn't need to know so appreciated the focussed content." 👌
About The Trainer:
Ian Littlejohn, a top-rated instructor on Udemy with over 5 years of experience and more than 250,000 students, has an average course rating of over 4.5 stars out of 5. His expertise lies in Data Analysis across various platforms including Excel, Power BI, Google Data Studio, and Amazon Quicksight. Ian's courses are renowned for their logical structure, ease of following, and clear communication – no time wasted!
Why You Should Sign Up:
- Comprehensive Video Content: Access 3.5 hours of in-depth video tutorials to guide you through mastering Pivot Tables in Google Sheets.
- Lifetime Access: Learn at your own pace, with full access to all course materials for life.
- Money-Back Guarantee: Enroll with confidence thanks to Udemy's 30-day money-back guarantee (see Udemy terms and Conditions).
- Certificate of Completion: Earn a certificate upon successful completion of the course – a testament to your new skills in data analysis.
About The Course:
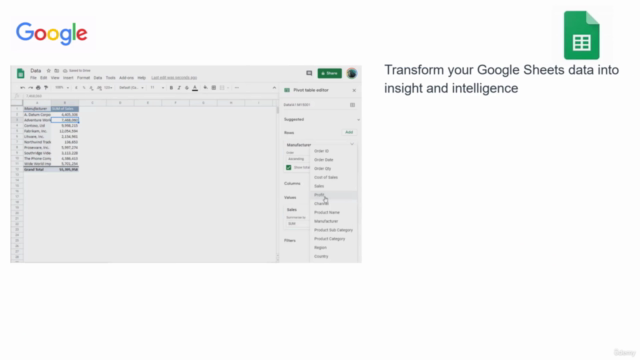
Google Sheets is an indispensable tool for data analysis and reporting, offering many features akin to traditional spreadsheet software, all within the cloud-based environment. In this course, we will harness one of Google Sheets' most POWERFUL features – Pivot Tables. You'll learn how to create them with just a few clicks!
This course is perfect for anyone looking to analyze data without delving into complex formulas. We'll cover everything from structuring your data correctly, summarizing and aggregating data, performing time/trend analysis, creating powerful custom calculations, all the way to analyzing Human Resources data and more. 📈💼
Here's what you will learn:
- Correctly Structure Your Data for efficient Pivot Table usage.
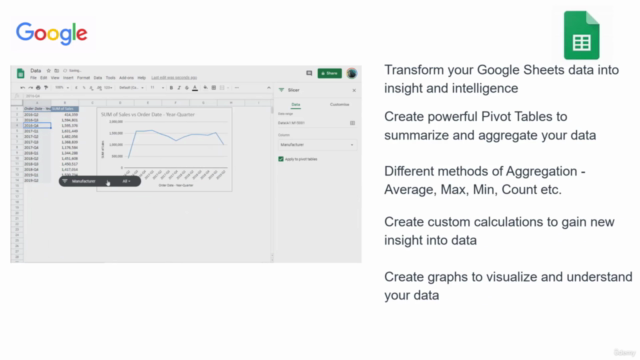
- Create Pivot Tables to summarize and aggregate your data.
- Utilize Different Methods of Calculation such as Sum, Count, Unique Count, Average, Median, Max, Min, and more.
- Develop Your Own POWERFUL Custom Calculations.
- Perform Time/Trend Analysis with easy-to-understand graphs.
- Filter and Ask Questions of Your Data to get the insights you need.
- Conduct Contribution Analysis with percentages and graphs.
- Analyze Human Resource Data to create powerful reports.
- Group Age and Salary Data for detailed analysis.
- Apply Conditional Formatting to Your Data for better visualization and understanding.
Join us today and turn your Google Sheets into a dynamic tool for data analysis with Pivot Tables! 📚✨
Course Gallery


Loading charts...