Learning Python for Data Analysis and Visualization

Why take this course?
🌟 Course Title: Learning Python for Data Analysis and Visualization
Headline: Master Data Analysis & Visualization with Python Using Real-Life Datasets! 🚀
Course Description:
Dive into the fascinating world of Data Analysis & Visualization With Python – a comprehensive online course meticulously designed for beginners and intermediate learners alike who aspire to transform raw data into compelling narratives using Python's powerful libraries. 📊✨
Why Learn Data Visualization for Data Science?
✅ Powerful Storyteller: Data Visualization is an indispensable tool that allows us to represent our data and findings in a way that's both insightful and impactful.
✅ Crucial Skill for ML Projects: Understanding data through visualizations is crucial when building Machine Learning models, as it helps in feature engineering and model evaluation.
✅ Clear Insights: Data Analysis provides actionable guidance rather than vague advice, enabling informed decision-making and the improvement of results and performance.
✅ Trends & Correlations: Visualization can reveal patterns, distributions, correlations, and anomalies in the data that are not immediately apparent through numbers alone.
✅ Enhanced Data Interpretation: Insights gained from visualizing the data aid in better understanding of underlying trends and behaviors, leading to more strategic business decisions.
Course Details:
This course is a treasure trove for those eager to learn how to:
-
Visualize Data with Python: Master the use of libraries like Pandas, Matplotlib, Seaborn, and Plotly to create informative and aesthetically pleasing visualizations.
-
Work on Real Projects: Engage with practical exercises and projects that mirror real-world data science scenarios.
-
Understand Core Concepts: Grasp the fundamental concepts of Data Analysis and Visualization through clear and concise lectures, accompanied by quizzes for quick revision and understanding reinforcement.
-
Kickstart Your Career: Equip yourself with the skills necessary to take your first steps into the world of Machine Learning and Data Science.
-
Systematic Learning Approach: Follow a structured path that starts with basic concepts and gradually progresses to more complex topics, ensuring a solid foundation is built along the way.
Your Learning Journey Awaits!
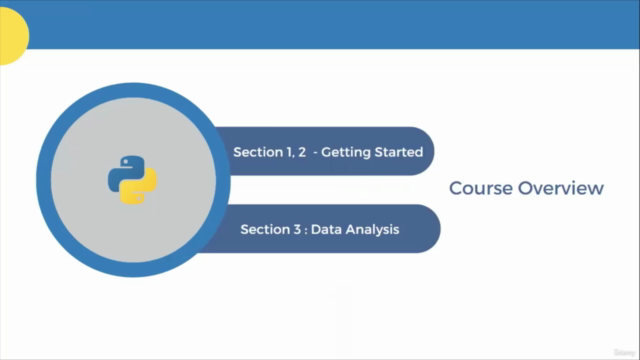
Embark on an exciting learning adventure with Learning Python for Data Analysis and Visualization. Each section of this course is carefully constructed to provide a rich hands-on experience, complete with practical exercises, real-life projects, and resources that will guide you through the nuances of data analysis and visualization.
Ease of Learning:
The course is designed with the learner's convenience in mind. Concepts are explained in simple terms, followed by practical lectures where you'll apply what you've learned, and then reinforced through quizzes. This approach ensures that you not only understand the material but also retain it for future use.
Enjoy & Excel:
I have thoroughly enjoyed the learning process in this course, and I am confident that with your dedication and commitment, you too will find the journey enriching and complete it with flying colors! 🎓
All the best as you embark on this transformative data science voyage. Your next step towards mastering Python for Data Analysis and Visualization is just a click away. Let's get started and turn your passion into profession together! 🚀💖
Course Gallery


Loading charts...