Python for Data Analysis / Data Science: A Crash Course

Why take this course?
🌟 Crash Course: Data Analysis using Pandas in Python 🌟
Course Description:
Embark on a transformative journey into the world of data analysis with our comprehensive "Crash Course: Data Analysis using Pandas in Python." This course is meticulously designed to guide you through every crucial aspect of data manipulation and analysis. Whether you're a beginner or looking to sharpen your skills, this course promises to equip you with the knowledge and techniques essential for effective data handling.
What You Will Learn:
-
Section 1: Getting Started with Python 🚀
- Installation of Anaconda distribution and writing your first code.
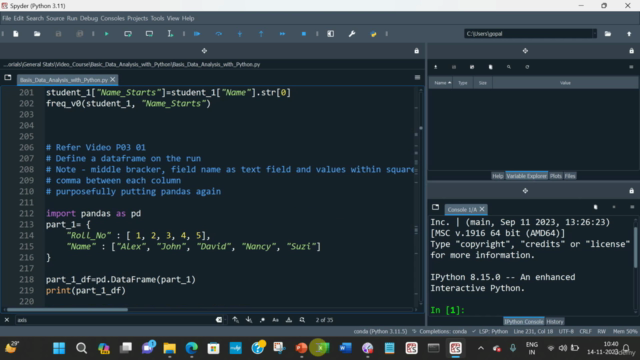
- A comprehensive walkthrough of the Spyder Platform to familiarize you with your new data analysis environment.
-
Section 2: Working on Data 📊
- Running SQL commands from within Python.
- Understanding dataset contents and adding comments for better code readability.
- Handling missing values, whether numeric or date-related, and creating copies of dataframes while filtering out records with missing values.
- Mastering numerical variable analysis, including group by operations and transposing results.
- Executing frequency distribution counts, including the percentage of missing values, and delving into functions and substring manipulations.
-
Section 3: Working with Multiple Datasets 🛠️
- Creating dataframes dynamically and appending or concatenating them.
- Merging datasets and mastering the art of removing duplicates.
- Advanced sorting techniques, finding records for max/min values, and leveraging
iterrowsto solve complex problems. - Deriving new variables from both numerical and character fields, as well as analyzing data based on date fields.
-
Section 4: Data Visualization 🎨
- Generating histograms, bar charts, line charts, pie charts, and box plots to visualize your data effectively.
- Revisiting some Python fundamentals to ensure you have a solid grasp of the language's capabilities.
- Understanding variable scope and utilizing range objects, casting, string slicing, and lambda functions.
-
Section 5: Statistical Procedures & Advanced Topics 🔍
- Identifying and treating outliers.
- Creating Excel-formatted reports.
- Crafting pivot tables on pandas dataframes, renaming column names, reading from/writing to SQLite databases, and more!
- Performing linear regression and conducting a chi-square test of independence.
Course Highlights:
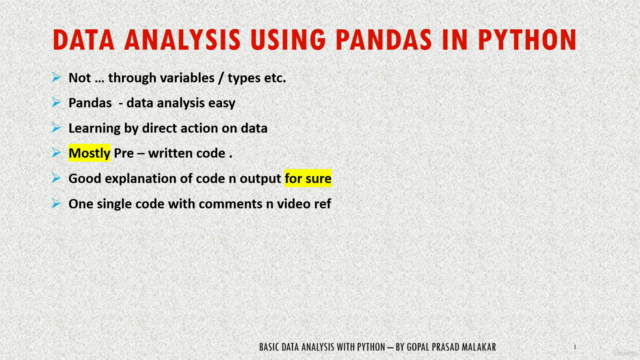
✅ Practical Approach: Learn by doing with real-world datasets and hands-on exercises.
✅ Expert Guidance: Gopal Prasad Malakar, an experienced instructor, will be your guide through this data analysis journey.
✅ Flexible Learning: Access the course materials at your convenience and learn at your own pace.
✅ Community Support: Engage with peers in our community forums to share insights and challenges.
Who Should Take This Course?
This course is designed for:
- Data analysts seeking to enhance their skill set.
- Aspiring data scientists looking to start a career in data analysis.
- Students who want to dive into the world of Python and data manipulation.
- Professionals from any domain interested in leveraging data to drive decision-making.
Join Us Today!
Embark on your data analysis adventure with our "Crash Course: Data Analysis using Pandas in Python." Enroll now to transform your approach to handling and analyzing data, and unlock the power of data insights! 📈🎉
Course Gallery


Loading charts...