Microsoft Excel - Data Analysis & Visualization

Why take this course?
📊 Microsoft Excel - Data Analysis & Visualization Course
Unlock the Power of Your Data with Excel's Advanced Tools!
Course Headline:
Master Data Analysis & Visualization with Excel using Power Pivot, Pivot Tables & Pivot Charts, and DAX!
Course Description:
Excel is more than just a spreadsheet application; it's a comprehensive tool for data analysis that's indispensable in the business world. Whether you're a financial analyst, a marketing strategist, or a data enthusiast, understanding how to leverage Excel's capabilities can give you a significant edge.
Who is this course for?
- Beginners: If you're new to Excel and want to build a strong foundation in data analysis.
- Intermediate Users: If you've been using Excel but are ready to dive deeper into its functionalities.
This course caters to all levels, ensuring everyone walks away with valuable insights and hands-on experience.
What You Will Learn:
**🚀 Key Skills & Techniques:
- Basic Operations: Importing data, organizing tables, and manipulating datasets.
- Data Analysis Tools: Introduction to Power Pivot, Pivot Tables, and Pivot Charts.
- Advanced Excel Functions: Mastering Data Analysis Expressions (DAX) for complex calculations.
- Data Visualization: Creating compelling visualizations to present your data effectively.
- Storytelling with Data: Learning how to narrate the story behind the numbers and make an impact.
Why Choose This Course?
- Practical Learning: Engage in real-world scenarios and exercises that mirror real business challenges.
- Industry-Relevant Content: Stay ahead of the curve by learning the latest tools and techniques in data analysis.
- Expert Guidance: Learn from experienced instructors who are experts in data analytics with Excel.
- Flexibility & Convenience: Access course materials anytime, anywhere, and fit your learning around your schedule.
- Community Support: Join a community of learners who can share insights and offer support.
Course Outline:
-
Introduction to Excel for Data Analysis
- Understanding the power of spreadsheets in data analysis.
- Exploring the Excel interface and its capabilities.
-
Data Import & Organization
- Reading data into Excel from various sources.
- Techniques for cleaning and organizing datasets efficiently.
-
Pivot Tables & Pivot Charts
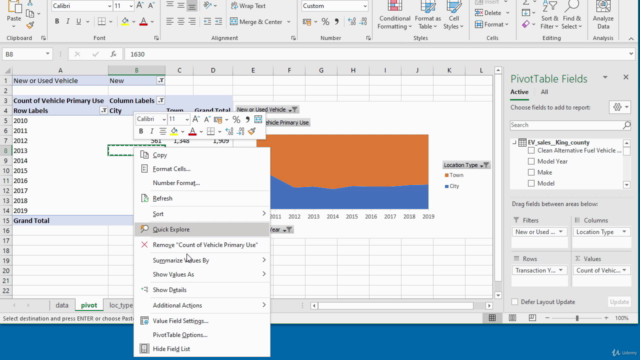
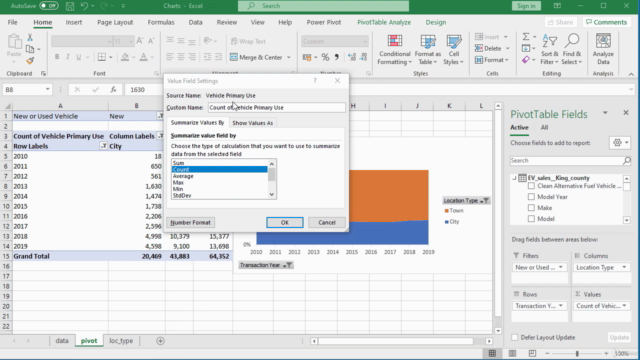
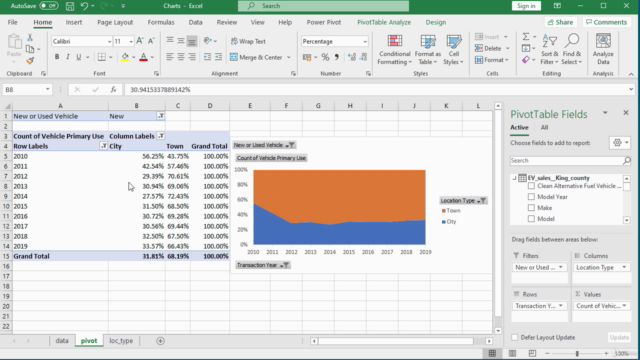
- Creating and customizing Pivot Tables to summarize large amounts of data.
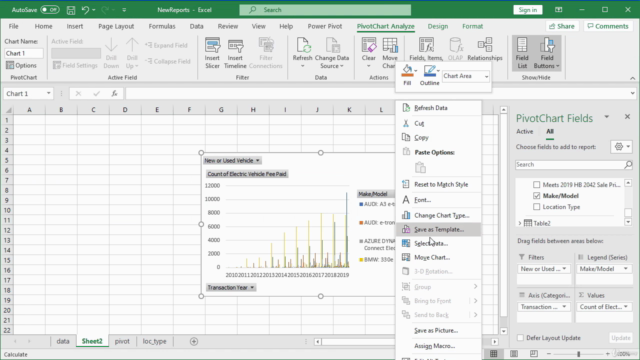
- Developing interactive Pivot Charts for dynamic visual representation.
-
Power Pivot for Data Management
- Learning how to use Power Pivot to handle large datasets.
- Tips on data modeling and creating meaningful relationships between data points.
-
DAX: The Language of Analysis
- Introduction to DAX and its role in advanced analysis.
- Writing DAX formulas to create custom calculations and measures.
-
Data Visualization & Storytelling
- Techniques for creating compelling data visualizations.
- Crafting data stories that convey insights effectively and influence decision-making.
Ready to Transform Your Data into Actionable Insights?
Join our Microsoft Excel - Data Analysis & Visualization Course today and become a data storyteller who can drive real business impact! 💼✨
Enroll now and embark on your journey to becoming an Excel expert with Bluelime Learning Solutions!
Course Gallery
Loading charts...