Data Analysis by Excel, SQL, Python and Power BI

Why take this course?
🎉 Master Data Analysis with Excel, SQL, Python & Power BI! 📊
Are you ready to dive into the world of data analysis and become a proficient Data Analyst or Business Analyst? 🚀 With the explosion of data in today's world, mastering data analytics has never been more crucial. This comprehensive course will equip you with the skills to not only collect and analyze data but also to extract meaningful insights and tell captivating data stories using Excel, SQL, Python, and Power BI. 🖥️
Course Overview:
📈 Data Analysis by Excel:
- Master the art of manipulating data with Excel functions, filters, statistical functions, slicers, and more.
- Learn to construct a variety of charts to visualize your findings effectively.
- Discover how to handle and analyze time-based data, update data connections, and work with external datasets.
🔍 Data Analysis by SQL:
- Dive deep into the world of databases with SQL queries.
- Understand the power of joins, sub-queries, and combining data from various sources.
- Gain command over DDL, DML, and DQL to retrieve and manipulate data efficiently.
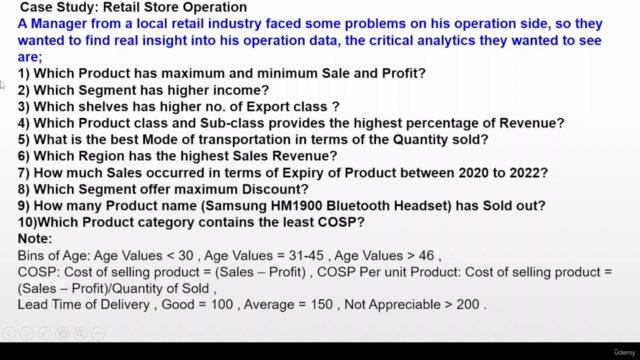
- Work on a real-world Case Study to apply your newly acquired SQL skills.
👨💻 Data Analysis with Python:
- Explore the fundamentals of object-oriented programming in Python.
- Learn to use Jupyter Notebooks for interactive data analysis.
- Familiarize yourself with libraries such as NumPy, Pandas, Matplotlib, and Seaborn for data cleaning, handling missing values, descriptive statistics, correlation analysis, and creating engaging visualizations.
- Engage in hands-on projects to solidify your understanding of Python's powerful data tools.
📊 Data Visualization & Reporting with Power BI:
- Discover the Power BI ecosystem and learn how to set up and navigate Power BI Desktop.
- Clean and transform data like a pro, and build robust data models.
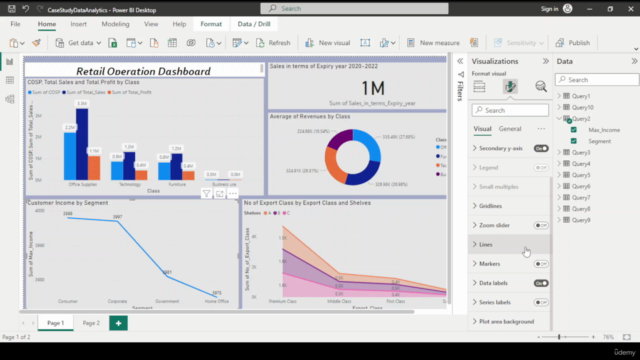
- Create compelling visualizations, apply filters and slicers, and design interactive reports and dashboards.
- Combine multiple data sources for comprehensive analysis.
- Work on real-world projects to gain practical experience in using Power BI.
What You Will Gain:
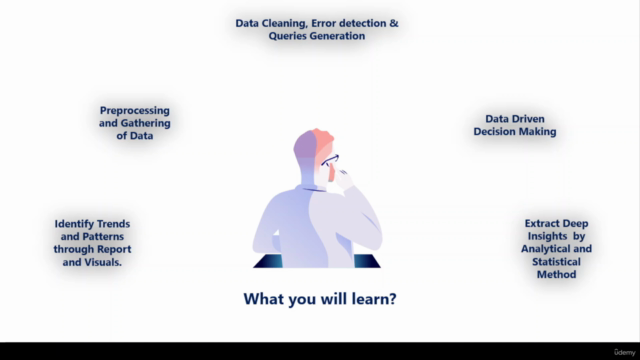
- A solid foundation in data analysis across various platforms.
- The ability to manipulate, analyze, visualize, and present data with precision and creativity.
- Hands-on experience through real-world projects and exercises that mirror the tasks you'll encounter in a professional setting.
- The confidence to take on the role of a Data Analyst or Business Analyst.
🎓 Enroll Now & Transform Your Career!
Don't miss out on this opportunity to become a data hero. Whether you're aspiring to launch a career in analytics, enhance your current skill set, or simply learn new tools and techniques for personal projects, this course is your stepping stone to success. 🌟
Hit the 'Enroll Now' button to start your journey towards becoming an expert Data Analyst or Business Analyst today! 🚀💻
Course Gallery
Loading charts...