Dashboards with Excel
Why take this course?
📊 Master Professional Dashboard Creation in Excel with Kristoffer Ditz
Course Headline:
"Dashboards with Excel: Create Professional Business Charts Step by Step"
Course Description:
Are you a controller or analyst looking to make your reports stand out? Or perhaps a business professional who wants to present data in a clear, impactful way? Look no further! In this comprehensive online course, Kristoffer Ditz, an expert with extensive experience at PUMA AG in worldwide Retail Controlling and a renowned author on Microsoft Excel, will guide you through the process of creating polished, professional Business Charts within Excel.
The Art of Conciseness - OPO: One Page Only
Let's face it, reports often drown readers in details that are not essential. They're cluttered with unnecessary elements and confusing visuals, along with too many legends that only add to the confusion. This course is about changing that narrative. With a focus on the OPO concept—One Page Only—you'll learn to distill complex data into concise, insightful dashboards that will make your reports a hit at board level.
Kristoffer Ditz - Your Instructor:
- Retail Controlling Expert: Kristoffer was responsible for a new Reporting System at PUMA AG's stores worldwide.
- Author and Publisher: With numerous articles and books on Microsoft Excel in Germany, Kristoffer is a trusted authority on the subject.
What You Will Learn:
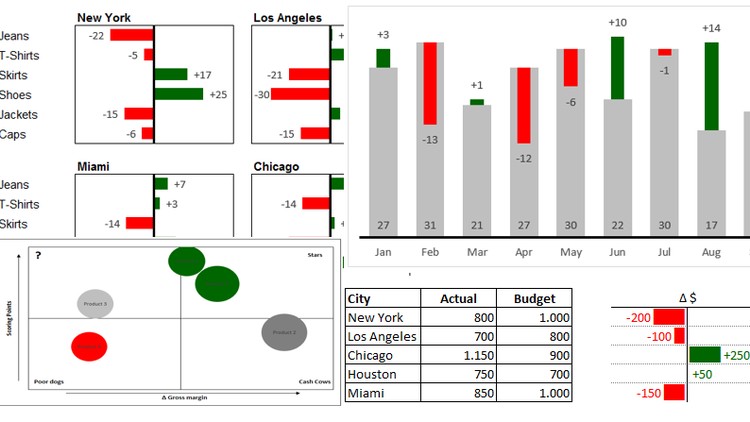
📈 Building a Professional Table: Start with the foundation of your dashboard - a well-structured table that presents data without the noise.
📊 Deviations (Euro and percents) in tables: Highlight important deviations to draw attention to significant figures or changes.
✅ Bar Charts: Learn how to use bar charts effectively to compare different values at a glance.
📈 Portfolio / 4 fields matrix: Organize complex data into a matrix that makes it easy to see what matters.
⏱ Charts for developments: Track changes over time with clear, informative charts that tell the story of your data.
📸 Using the Excel Camera: Capture your work as an image for presentations or reports without losing any interactivity.
Bonus:
- You will receive the Excel training file that includes all the formulas and solutions discussed in the course.
Course Objective:
Upon completing this video course, you will have a solid understanding of the key techniques and methods for successful reporting. You'll be equipped with the knowledge to create professional dashboards in Microsoft Excel that will impress your peers, management, or clients.
Prerequisites:
- Basic knowledge of MS Office is required.
- An Excel version on your own computer is necessary to follow along and apply what you learn.
Important Notes:
The video course content is based on Excel 2016, but the techniques and tools covered are applicable to Excel 2010 and 2007 as well. The approach is very similar across these versions, ensuring you can adapt what you learn to your specific Excel environment.
Embark on a journey to transform your data into a story with visuals that speak for themselves. Enroll in "Dashboards with Excel: Create Professional Business Charts" today and take the first step towards becoming a data storyteller! 🚀📊
Course Gallery
Loading charts...