D3.js - the art of data visualization

Why take this course?
🎉 Mastering Data Visualization with D3.js 📊
Welcome to the Course!
Are you ready to unlock the full potential of data storytelling? With the power of D3.js, you can transform raw datasets into compelling narratives that captivate your audience and bring complex data to life. This course is your gateway to mastering one of the most powerful JavaScript libraries for data visualization out there!
🚀 What You'll Learn 🚀
-
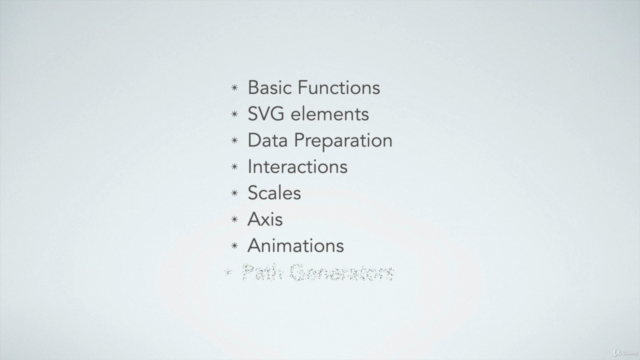
Understanding D3.js Basics: Dive into the core concepts of D3.js, its architecture, and how it integrates with modern web technologies.
-
Data-Driven Document Creation: Learn the fundamentals of manipulating the Document Object Model (DOM) using D3.js to represent data graphically.
-
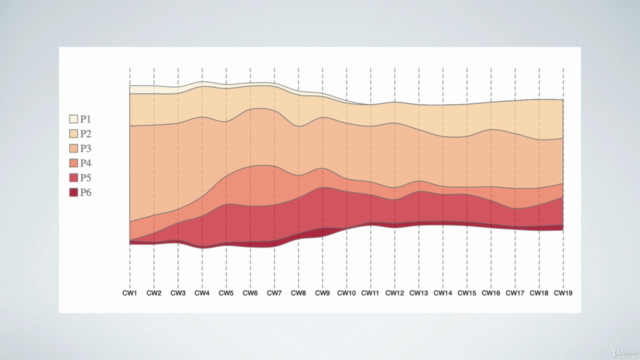
Visualization Techniques: Explore a variety of visual representations, from bar charts and line graphs to advanced interactive visualizations.
-
Data Binding: Master the art of binding datasets to your visual elements, ensuring dynamic updates as data changes.
-
Custom Visualizations: Go beyond the basics to create custom visualizations that stand out and make an impact on your audience.
-
Interactivity: Make your visualizations interactive, enabling users to engage with the data in a meaningful way.
-
Responsive Design: Ensure your visualizations are responsive, adapting gracefully to any screen size or device.
Course Highlights:
-
Comprehensive Curriculum: This course is designed for learners of all levels, from beginners to seasoned developers who want to refine their skills.
-
Real-World Projects: Apply your knowledge by working on real-world projects that showcase the power and versatility of D3.js.
-
Best Practices: Learn best practices for performance optimization, accessibility, and responsive design in data visualization.
-
Community Support: Join a community of fellow learners and professionals who are passionate about data visualization. Share ideas, collaborate on projects, and help each other grow.
-
Expert Instruction: Marek Pilczuk, an experienced D3.js instructor with a track record of teaching complex topics in a simple and engaging manner, will guide you through the course material.
Who Is This Course For?
-
Data Analysts and Scientists who want to present their findings more effectively.
-
Web Developers looking to add data visualization capabilities to their skill set.
-
UI/UX Designers aiming to enhance user interfaces with dynamic, data-driven visualizations.
-
Educators and Students in search of innovative ways to display and interpret data.
-
Entrepreneurs and Business Owners who wish to visualize sales figures, customer behavior, or other critical business metrics.
Enroll now to start your journey toward becoming a data visualization expert with D3.js! Let's make your data not just seen but experienced. 🌟
Course Gallery


Loading charts...