D3.js in Action: Build 17 D3.js Data Visualization Projects

Why take this course?
🚀 D3.js in Action: Build 17 D3.js Data Visualization Projects! 🚀
Why Learn D3.js? 📊✨
"A picture is worth a thousand words." This adage holds especially true in the realm of data science and analysis, where interpreting large datasets can be a daunting task for many. Data visualization emerges as an invaluable tool to simplify complexity and extract meaningful insights from mountains of data. With D3.js, you can craft compelling visual stories that bring your data to life!
D3.js (Data Driven Documents) is a robust, open-source JavaScript library that allows developers like you to manipulate documents using HTML, SVG, and CSS. It binds datasets to the DOM, enabling dynamic, responsive, and interactive visualizations. By learning D3.js, you can transform raw data into informative and captivating visual narratives, making complex data understandable for any audience.
What This Course Offers: A Journey from Scratch to Mastery with D3.js V5 🛠️🎓
- 100% Practical and Hands-On: This course is designed to get you coding along from the very start, ensuring that you learn by doing.
- Taught by a Skilled Instructor: Unlike other courses that rely on pre-written code samples, our instructor codes alongside you, providing a genuine learning experience.
- Latest Version: We cover D3.js version V5, the latest iteration of this powerful library, ensuring you're up-to-date with current practices and capabilities.
- Clear & Detailed Explanations: Every concept is thoroughly explained with a focus on clarity, making complex ideas easy to understand.
- Boost Your Confidence: By completing 17 projects from scratch, you'll build the confidence to tackle real-world data visualization tasks on your own.
Project Highlights: Transform Data into Visuals with D3.js 🎨🔧
Here's a sneak peek at the 17 projects you'll undertake as part of this course:
- Horizontal Bar Chart - Visualize data in a clear and easy-to-understand format.
- Vertical Bar Chart - Analyze data with a traditional bar chart presentation.
- Vertical Bar Chart with Axes - Add precision to your bar charts with axes for a more detailed view.
- Scatterplot - Explore relationships and distributions through points.
- Line Chart - Trace trends over time with a simple yet powerful line graph.
- Area Chart - Understand the cumulative data flow by visualizing it as an area under the curve.
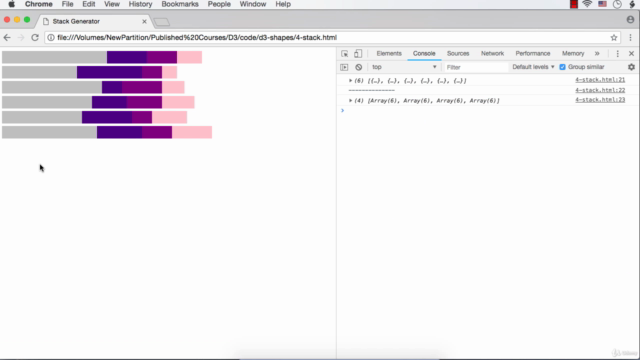
- Stacked Area Chart - Gain insights into layered datasets and their contributions.
- Pie Chart with Legend - Slice up your data to show proportions in a circle.
- Animated Bar Chart - Bring your static bar charts to life with animation.
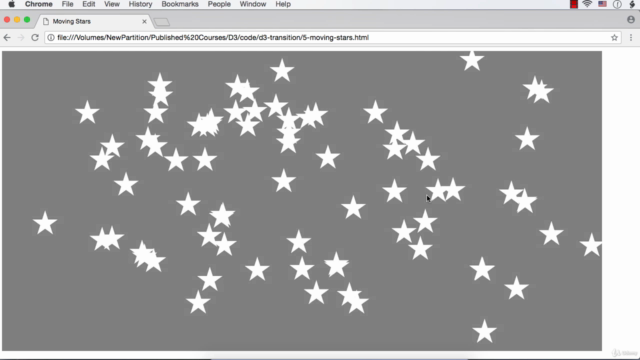
- Moving Stars - Create dynamic and captivating animations to represent changes over time.
- Make Me Laugh - Add some fun with interactive visualizations that respond to user input.
- Family Tree - Construct a visual representation of family relationships.
- Classic Family Tree - Dive deeper into genealogy with this detailed project.
- Tree with Images - Personalize your visualizations by including images within the data structure.
- Complete Family Tree - A comprehensive take on the family tree, complete with interactivity.
- Zoomable Family Tree - Enable users to explore details of the family tree by zooming in and out.
- Ancestry Chart - Trace ancestral lineage across generations.
By enrolling in this course, you're not just learning D3.js; you're equipping yourself with a versatile skill set that will open doors to countless possibilities in data visualization. Join us on this exciting journey and turn your passion for coding and data into captivating visualizations! 🌟
Enroll Now and Transform Data into Impactful Stories with D3.js! 🎖️🚀
Course Gallery


Loading charts...