Creating Heatmaps and Clustering in R
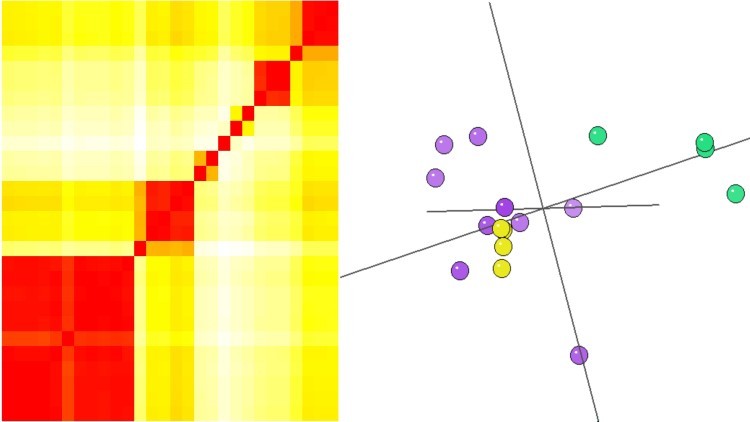
Why take this course?
_Course Title: Creating Heatmaps and Clustering in R with Dr. Matthew Cserhati 🚀
_Course Headline: Master Data Visualization & Analysis for Impactful Insights! 📊✨
Welcome to a Journey in Bioinformatics and Data Analysis!
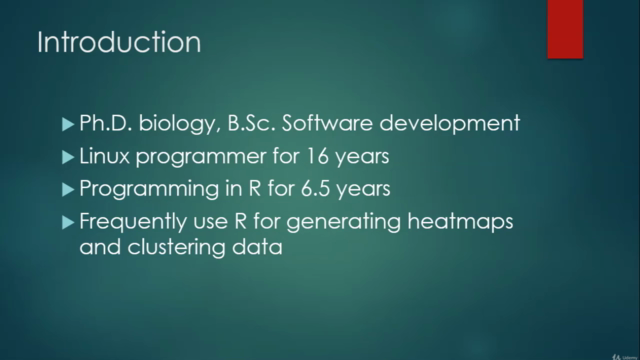
Introduction: Greetings, data enthusiasts! I'm Dr. Matthew Cserhati, your guide on this enlightening journey through the world of R, heatmaps, and clustering. With a PhD in bioinformatics and over 18 years of programming expertise, I have honed my skills to tackle complex data analysis challenges. My work at a leading biotech company is where these skills shine every day.
Course Overview: This practical course is designed to transform your data into compelling visualizations and uncover meaningful clusters through the powerful capabilities of R. Whether you're a researcher, a data analyst, or simply an R enthusiast, this course will equip you with the tools to create beautiful heatmaps and apply robust clustering methods to your datasets.
What You'll Learn:
- Understanding Clustering Algorithms: Dive into the world of k-means clustering, PAM clustering, and more! Learn how these algorithms work and the theoretical framework behind them. 🎓
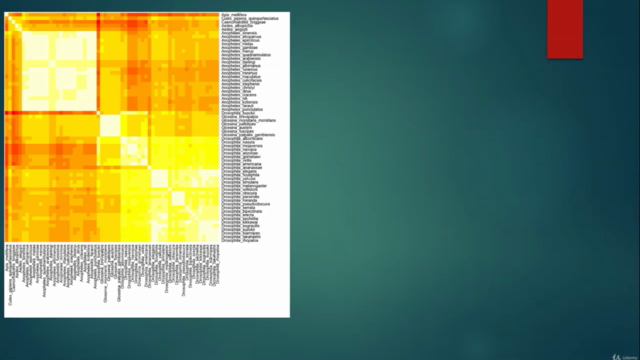
- Visualizing Data with Heatmaps: Master the art of creating stunning heatmaps using R's
heatmapandpheatmapfunctions. Visualize your data in ways that tell a story. 🌡️ - Evaluating Clusters Scientifically: Utilize silhouette plots and elbow plots to evaluate the quality of your clusters. Ensure your analysis is robust and reliable. 🔍
- Practical Experience: Engage with real datasets in multiple hands-on lessons, applying what you've learned to practical scenarios. 💻
Course Highlights:
- Learn at your own pace with engaging video content.
- Gain insights from a seasoned professional with real-world experience.
- Enhance your research toolkit with advanced bioinformatics techniques.
- Suitable for students and professionals in biology, math, physics, geology, medicine, or any field that requires data analysis.
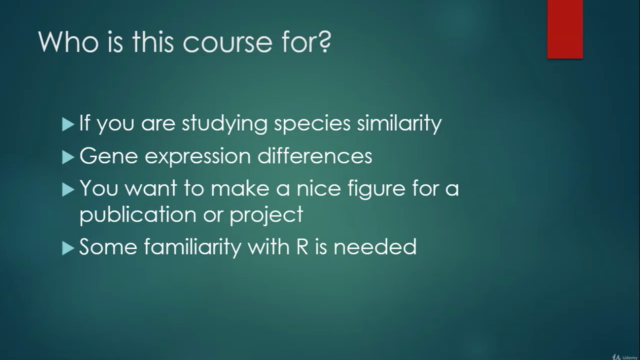
Who Is This Course For? This course is designed for anyone with a basic understanding of R programming. Whether you're a beginner or an experienced programmer looking to expand your skillset, this course will provide valuable knowledge and practical experience.
Additional Resources: Don't miss out on my other courses, including in-depth lessons on the kraken2 database and bioinformatics tools for COVID research. These complementary courses are also available on Udemy, providing a comprehensive learning path for those interested in expanding their expertise in these areas.
Conclusion: If you're ready to transform your data into actionable insights with heatmaps and clustering in R, then this is the course for you! Join me, Dr. Matthew Cserhati, on this analytical adventure and elevate your data analysis skills to new heights. 🌟
Happy coding, and I look forward to seeing you in class! Let's decode the complexity of data together. Enroll now and embark on a journey that will not only enhance your professional capabilities but also ignite your passion for data visualization and analysis. 🚀
Course Gallery
Loading charts...